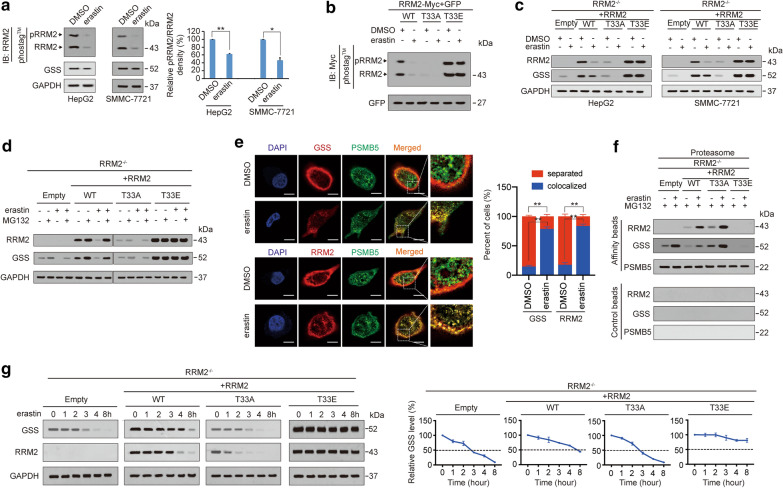
Fig. 4.
Phosphorylation of RRM2 at T33 protects GSS from proteasome degradation. a pRRM2 and RRM2 were measured by immunoblotting using anti-RRM2 antibodies following electrophoresis in gels containing Phos-tag™, while GSS was measured by immunoblotting using anti-GSS antibodies following electrophoresis in conventional gels. HepG2 and SMMC-7721 cells were cultured in the presence or absence of erastin (10 μM) for 24 h. Relative pRRM2/RRM2 ratios between groups were also calculated and graphed. b RRM2 was phosphorylated at T33. pRRM2 and RRM2 levels were measured by immunoblotting with anti-Myc antibodies following electrophoresis in Phos-tag™-containing gels of HepG2 cells ectopically expressing RRM2WT, RRM2T33A or RRM2T33E before and after treatment with erastin (10 μM) for 24 h. c RRM2 and GSS were measured by immunoblotting in RRM2−/− HepG2 and SMMC-7721 cells ectopically expressing RRM2WT, RRM2T33A or RRM2T33E before and after treatment with erastin (10 μM) for 24 h. d RRM2 and GSS were degraded by proteasomes. RRM2 and GSS were measured by immunoblotting in HepG2 cells with the indicated treatments. Erastin and MG132 were treated at concentrations of 10 μM and 8 μM, respectively, for 24 h. e Colocalization of GSS (upper) or RRM2 (lower) with PSMB5 in HepG2 cells cultured in the presence or absence of erastin (10 μM, 24 h). Scale bar, 20 μm. f Association of RRM2, GSS and PSMB5 in proteasomes isolated from HepG2 cells cultured in the presence or absence of erastin (10 μM, 24 h) in the presence of MG132 (8 μM, 24 h). Samples from affinity or control beads were analyzed in parallel. g Erastin (10 μM, 24 h) chase of GSS and RRM2 in RRM2−/− HepG2 and SMMC-7721 cells reconstituted with RRM2WT, RRM2T33A or RRM2T33E. The levels of GSS were also normalized to those of GAPDH, and the normalized level of GSS in the 0 h group was arbitrarily set to 100%. The data are shown as the mean ± SD from three biological replicates (including IB). *P < 0.05, **P < 0.01 indicates statistical significance. Data from a were analyzed using a one-way ANOVA test. Data from e were analyzed using Student’s t test

