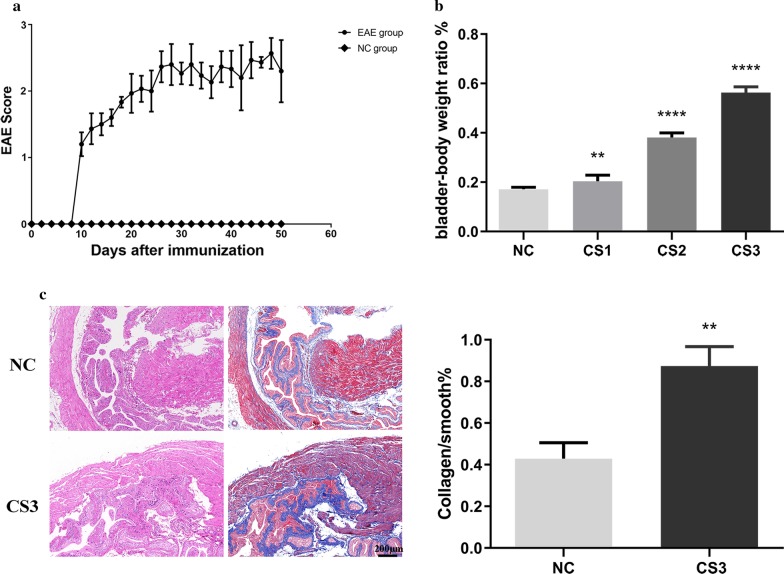
Fig. 1.
EAE-induced bladder wall fibrosis in mice. Female C57BL/6 mice were used to establish EAE using MOG 35–55. After immunization, the disease development was scored according to clinical symptoms (CS), and the body weight and neurological deficit of the mice were examined daily and scored on a scale of 0–5, where CS0 = no disease; CS1 = tail weakness and/or moderately awkward gait and/or poor righting ability; CS2 = tail weakness and/or moderately awkward gait; CS3 = hind limb paralysis or mild forelimb weakness (or both); CS4 = limb paralysis; and CS5 = quadriplegia with detained urine or death. a EAE progression in mice is indicated by the mean clinical score. The error bars show ± SE. b The bladder-to-body weight ratios were significantly greater in EAE mice than in normal control mice (NC) (n = 3 mice/group). c Only the degree of bladder smooth muscle layer tissue fibrosis was evaluated. Left: H&E, Right: Masson’s trichrome stain. The red areas indicate smooth muscle, and the blue areas indicate connective tissue. The collagen-smooth-muscle ratio was determined by the mean Masson’s trichrome staining data in the NC and CS3 groups (n = 3 mice/group). The data are expressed as the mean ± SD. NC, normal control group; CS, clinical symptoms. **P < 0.01, ****P < 0.0001 versus control. Scale bar = 200 μm

