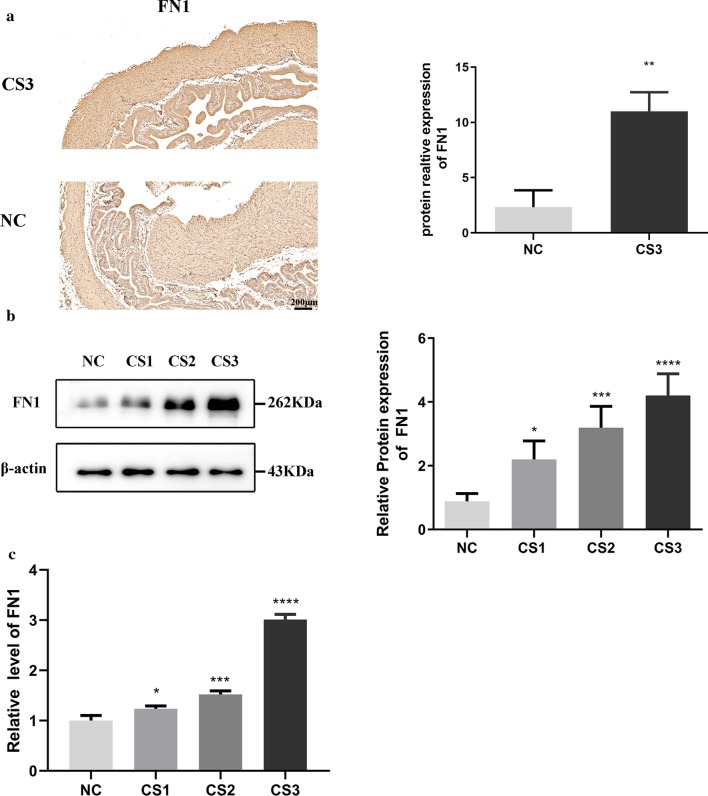
Fig. 2.
FN1 expression in EAE-induced fibrotic bladder tissue. a The expression of FN1 in bladder fibrosis with different scores was analyzed by immunohistochemistry. b The expression of FN1 in bladder fibrosis with different scores was analyzed by Western blotting. c The expression of FN1 in bladder fibrosis with different scores was analyzed by RT-qPCR. The findings were from three separate experiments. The data are expressed as the mean ± SD. NC, normal control group; CS, clinical symptoms; FN1, fibronectin 1. nsP > 0.05, *P < 0.05, **P < 0.01, ***P < 0.001, ****P < 0.0001 versus control. Scale bar = 200 μm

