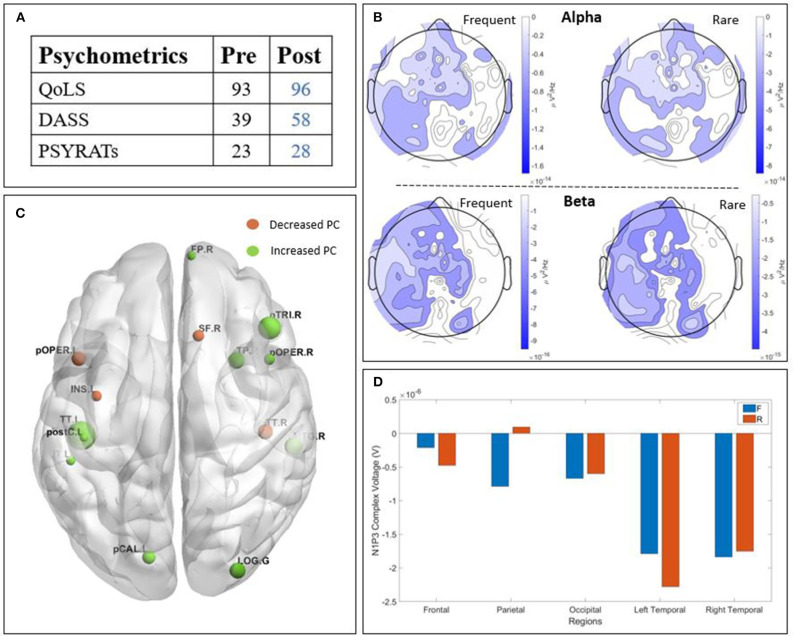
Figure 6.
Results of patient T5 : (A) psychometric; (B) Scalp-level frequency analysis; (C) Source-space connectivity; (D) Scalp-level time analysis. The yellow areas in frequency analysis are related to a higher Power Spectral Density (PSD) post-treatment, whereas the blue ones are related to a higher PSD pre-treatment. The size of the node in the connectivity is related to the amount of increase (green) or decrease (orange) participation coefficient (PC) values. The positive bars in time analysis are related to a higher N1-P3 amplitude post-treatment. (QoLS, Quality of Life Scale; DASS, Depression Anxiety Stress Scale; PSYRATS, Psychotic Symptom Rating Scales).

