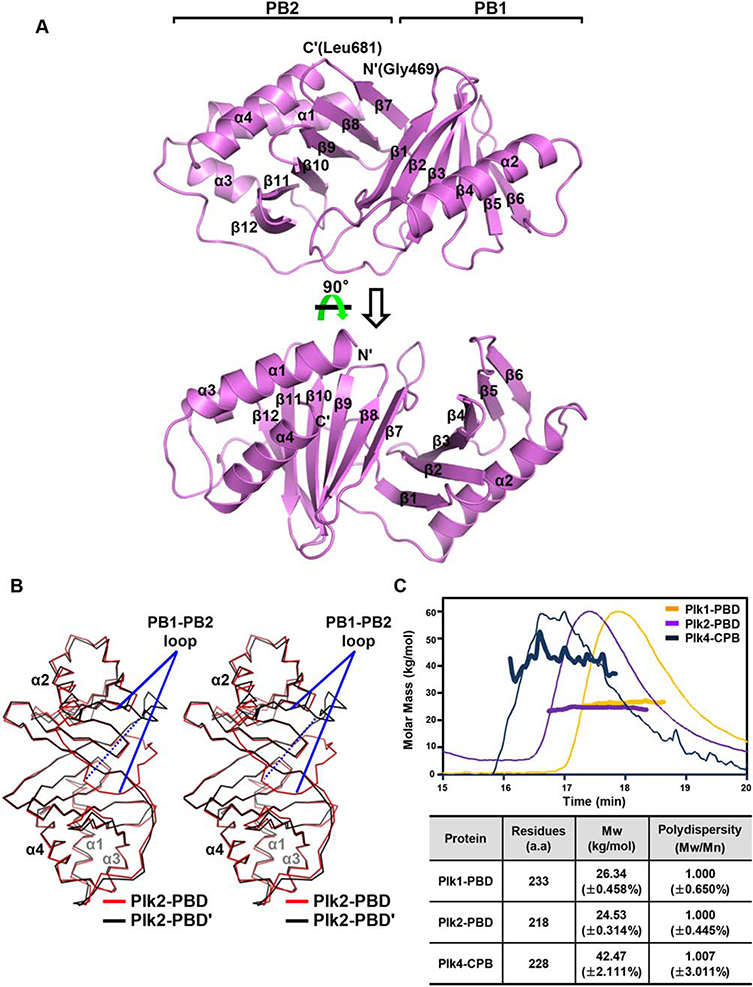
Figure 1.
Crystal structure of Plk2-PBD. (A) Two views of the monomeric structure. Plk2-PBD is presented as ribbon drawings with the labels of secondary structures according to the order of their appearance in the primary sequence. Also labeled at the top are two subdomains of the molecule. (B) Structural superposition of two subunits in the asymmetric unit shown in Cα traces. For clarity, α-helices of the two monomers are labeled only. PB1-PB2 loops showing dramatically different location are indicated. The dashed line highlights the distance of the Cα atoms of two Gly586 residues where the loops are furthest apart. (C) SEC-MALS analysis of three PBDs. (Top) Molar masses (in kg/mol) are plotted against the elution time (in min) from the size exclusion column. (Bottom) Plk4-CPB, but not Plk1-PBD or Plk2-PBD, forms a dimer. Mw, weight-average molar mass; Mn, number-average molar mass.

