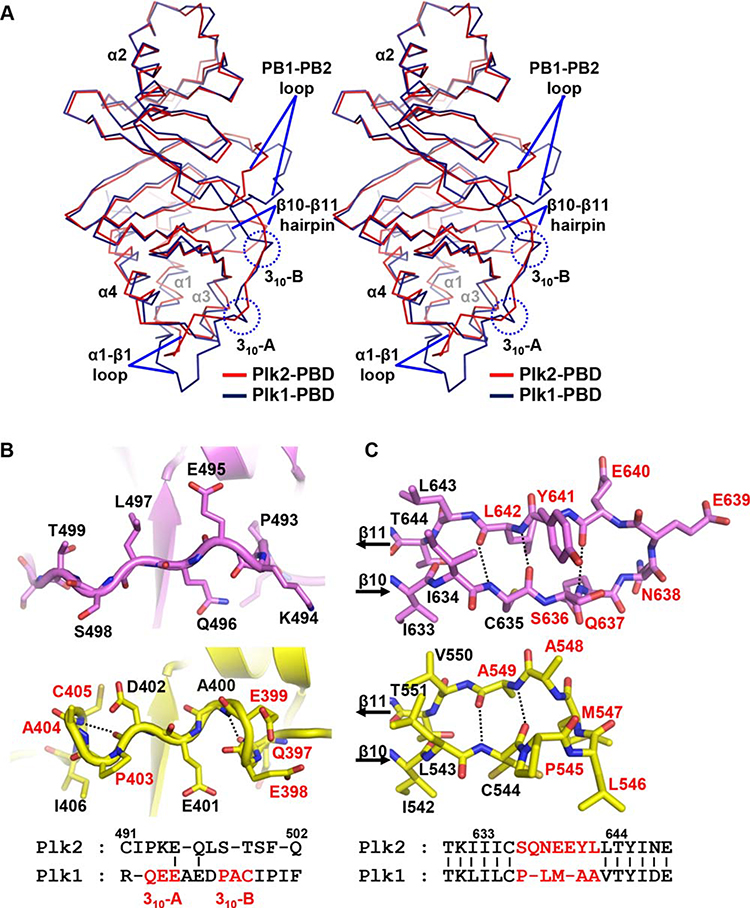
Figure 2.
Structural comparison with Plk1-PBD. (A) Superposition of Plk2-PBD (red) onto Plk1-PBD (deepblue; PDB code 3HIH) both shown in Cα trace representation. Labeled are α-helices of the two monomers. Regions showing prominent structural discrepancies are indicated: α1-β1 loop (including two 310-helices only present in Plk1-PBD), the PB1-PB2 loop and β10-β11 hairpin. (B) Two 310-helices present in Plk1-PBD (yellow) are not conserved in Plk2-PBD (violet). The Plk1 residues constituting the 310-helices are labeled in red in both ribbon drawings (top) and sequence alignment (bottom). Dashed lines highlight i → I + 3 hydrogen bonding patterns. (C) β10-β11 hairpin loop. Hydrogen bonds between the β10 and β11 strands of Plk2-PBD (violet) and Plk1-PBD (yellow) are represented as dotted lines. Residues that are not conserved between the two proteins are labeled in red (seven in Plk2 and five in Plk1), and the others are in black, in both stick presentation (top) and sequence alignment (bottom).

