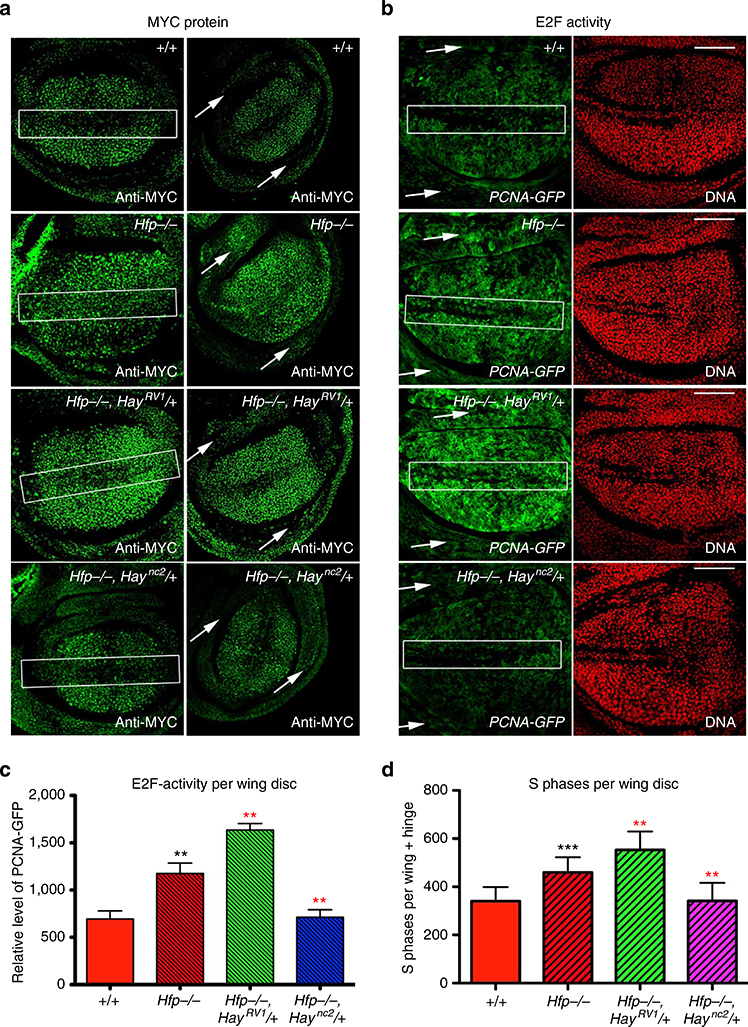
Figure 3 |. Hay mutants differentially modify MYC protein patterning, E2F-activity and S phase progression in Hfp hypomorphs.
(a) MYC antibody staining (green) for genotypes marked. The white rectangles mark the ZNC and white arrows mark the hinge domain. All scale bars represent 50 um. (b) PCNA–GFP activity (green) and DAPI (red) for genotypes marked. (c) Quantification of PCNA–GFP activity. The graph shows the relative intensity for GFP (mean pixel intensity±s.e.m.) for each genotype (see Supplementary Table 5 for quantification and number of biological replicates). (d) Quantification of S phase using BrdU. The graph shows number of BrdU positive cells (±s.e.m.) in wing discs for genotypes marked (see Supplementary Table 6 for quantification and number of biological replicates). The black asterisks show significance points compared with control; red asterisks compared with Hfp hypomorph alone. Statistical tests were performed with Graphpad Prism 6 using unpaired two-tailed t-test with 95% confidence interval. In all figures error bars represent s.e.m. and according to the Graphpad classification of significance points *P = 0.01–0.05, **P = 0.001–0.01, ***P = 0.0001–0.001 and ****P<0.0001.

