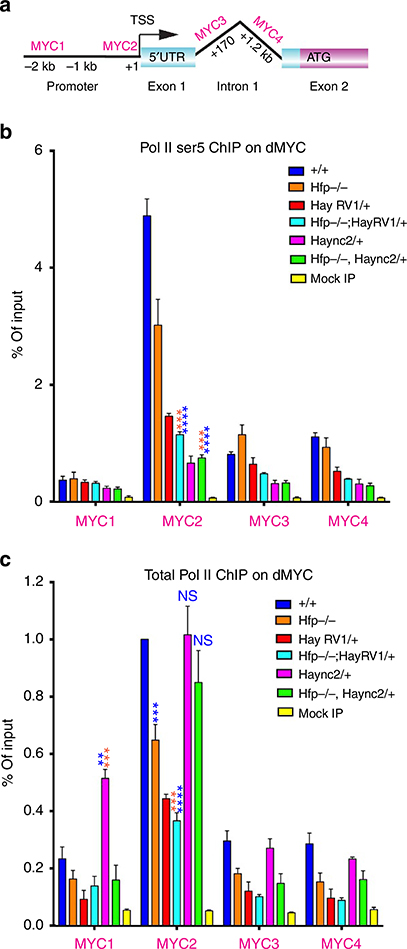
Figure 5 |. Hay mutants affect RNA Pol II enrichment across the dMYC promoter.
(a) Schematic of dMYC showing the position of the amplicons used for qPCR. (b) ChIP for Ser 5 RNA Pol II and (c) ChIP for total RNA Pol II (see Supplementary Table 11,12 for quantification and number of biological replicates). Statistical tests were performed with Graphpad Prism 6 using unpaired two-tailed t-test with 95% confidence interval. In all figures error bars represent s.e.m. and according to the Graphpad classification of significance points *P = 0.01–0.05, **P = 0.001–0.01, ***P = 0.0001–0.001 and ****P<0.0001.

