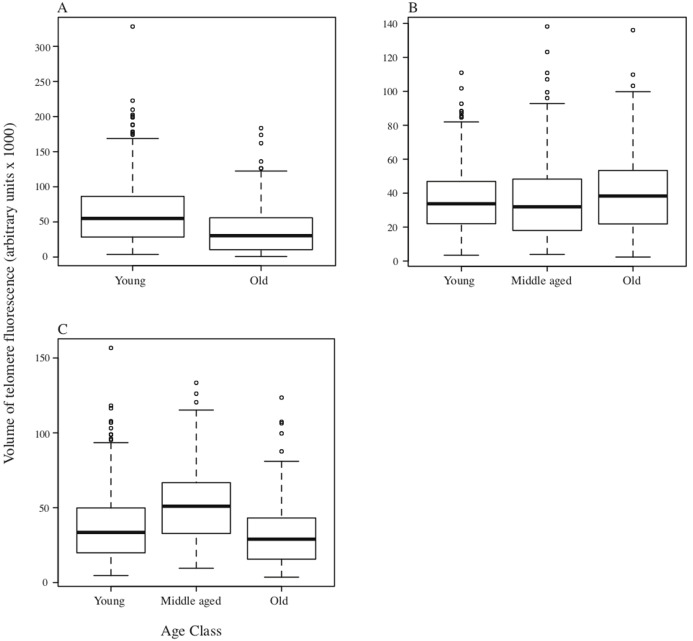
Figure 2. Boxplots depicting medians and interquartile ranges for telomere size (expressed as volume of telomere fluorescence) variation with age class.
(A) DMR (n = 6 animals in each age class); (B) MMR (n = 8, 14 and 6 individuals for young, middle-aged and old age classes respectively); (C) NMR (n = 3, 4 and 3 individuals respectively).

