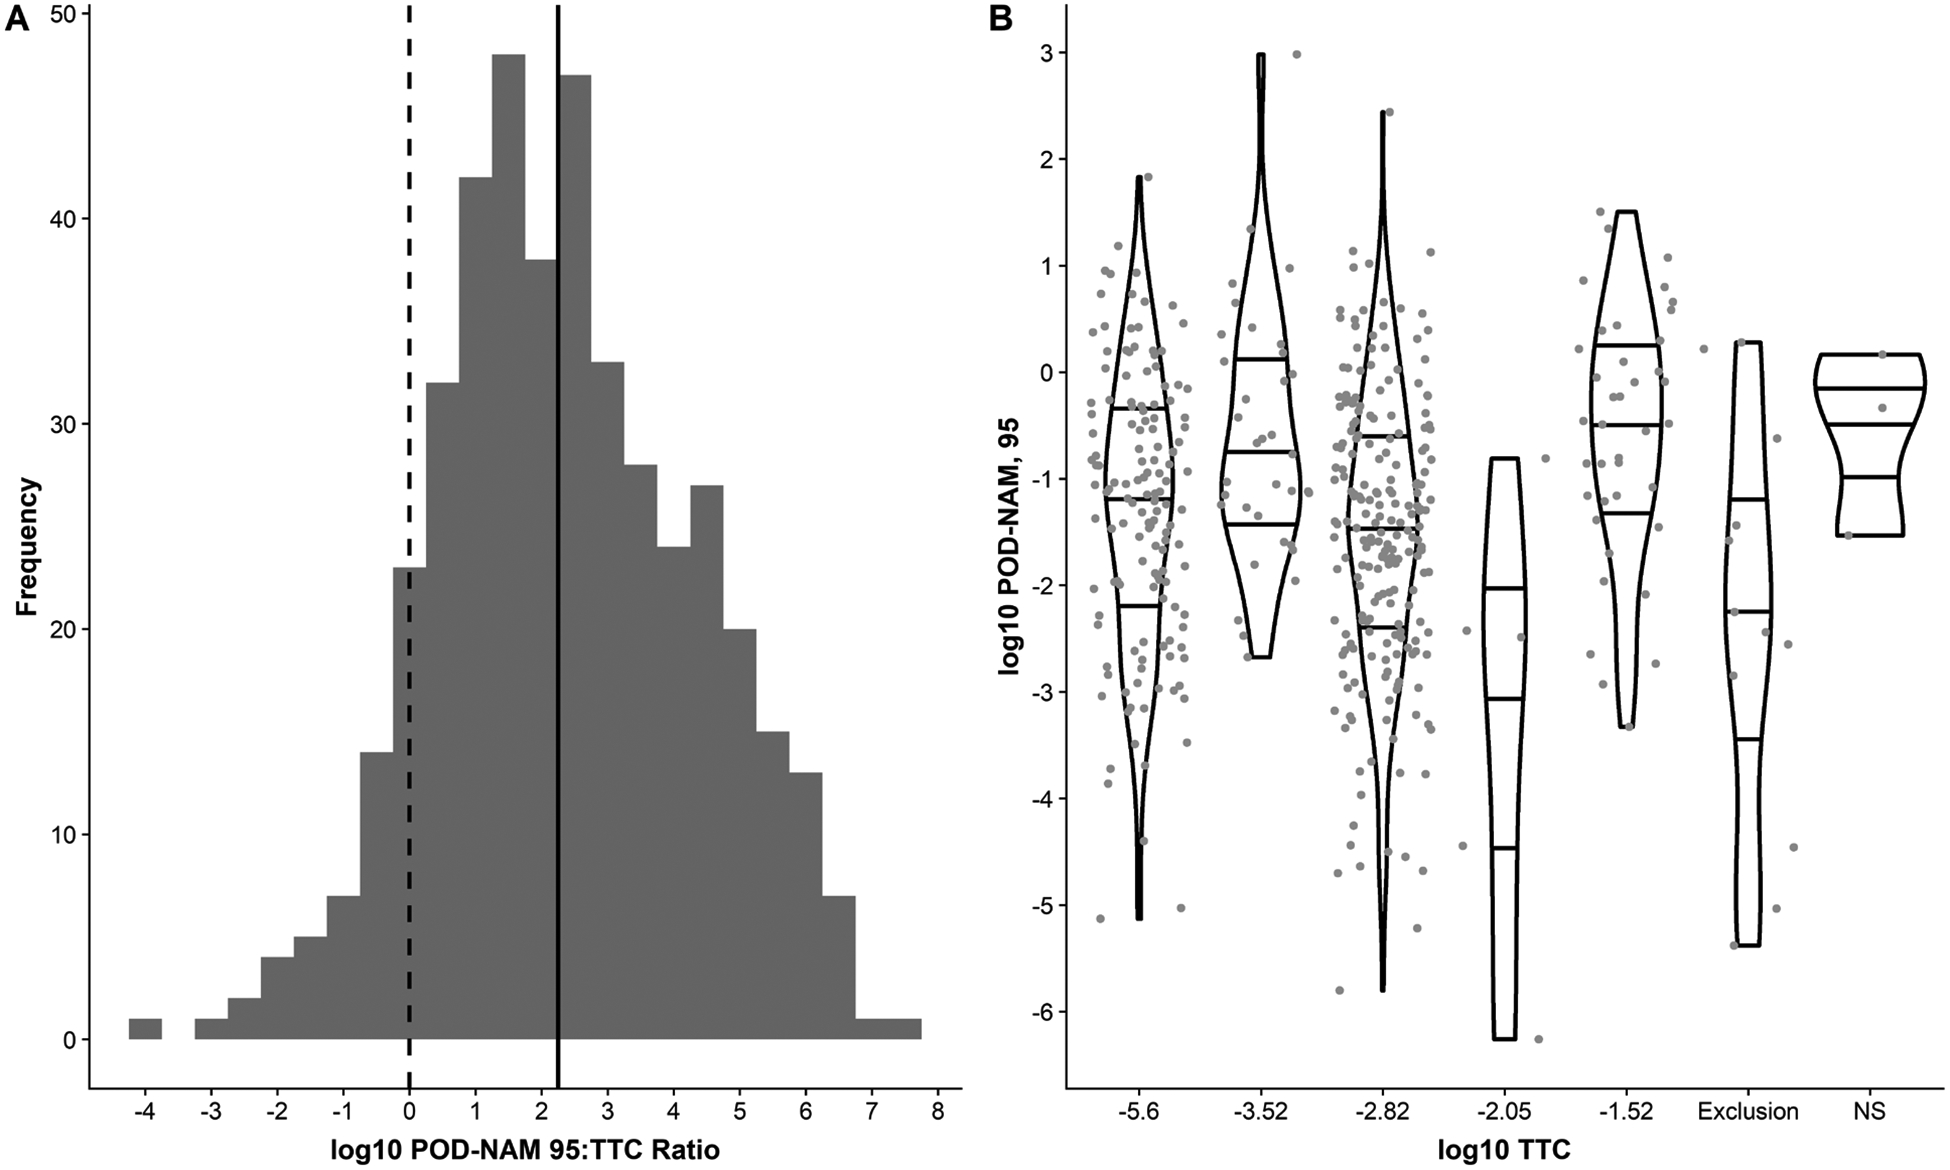
Figure 9. PODNAM,95 compared to the TTC.

The log10TTC: PODNAM,95 ratio is illustrated for the 448 case study chemicals in (A). In (B), the log10 TTC value bin is compared to the log10PODNAM,95, in units of log10-mg/kg/day; dots represent all points and violin plots capture the shape of the distribution.
