Table 3.
Chemical features enriched in the log10POD ratio95 < 0 set.
| ChemoType Information | Appearance of the ToxPrint | Metrics | ChemoType Information | Appearance of theToxPrint | Metrics | ||||||||||
|---|---|---|---|---|---|---|---|---|---|---|---|---|---|---|---|
| Label | ToxPrint | Total | POD ratio SO | POD ratio ≤0 | BA | OR | p-value | Label | ToxPrint | Total | POD ratio ≤ 0 | POD ratio > 0 | BA | OR | p-value |
| bond:P=O_phosphorus_oxo | 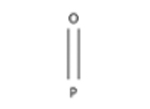 |
18 | 12 | 6 | 0.62 | 22 | 7.4E-09 | bond:P~N_generic | 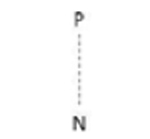 |
5 | 4 | 1 | 0.54 | 36 | 0.00055 |
| bond:P=O_phosphate_thio | 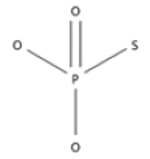 |
3 | 3 | 0 | 0.53 | NA | 0.0012 | bond:C(=O)N_carbamate | 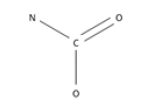 |
20 | 6 | 14 | 0.54 | 3.9 | 0.014 |
| bond:P~S_generic | 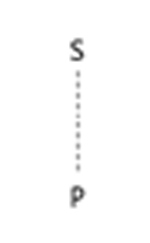 |
27 | 13 | 14 | 0.62 | 10 | 3.5E-7 | bond:CS_sulfide |  |
53 | 15 | 38 | 0.61 | 4.3 | 0.00011 |
The enriched chemical structural features, as represented by ToxPrints, for the log10POD ratio95 < 0 set. BA = balanced accuracy; OR = odds ratio; POD ratio = log10POD ratio95.
