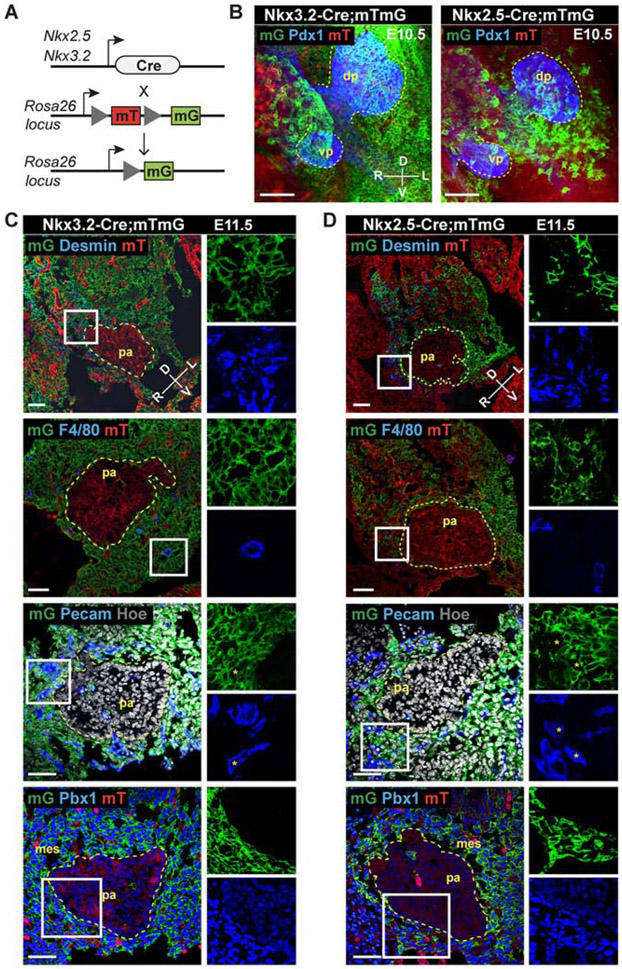
Figure 1. Mesenchymal lineages expressing Nkx3.2 and Nkx2.5 surround the embryonic pancreas.
A, Schematic representation of the strategy for labelling Nkx3.2- and Nkx2.5-expressing mesenchymal cells with GFP (mG). B, Representative confocal maximum intensity z-projections of whole-mount immunofluorescence (IF) for Pdx1 (blue) on E10.5 Nkx3.2- and Nkx2.5-Cre;mTmG embryos. Yellow dashed lines mark pancreatic buds; in green (mG), surrounding mesenchyme; in red (mT), non-recombined tissue. dp, dorsal pancreas; vp, ventral pancreas. n = 3 independent embryos of each genotype. Scale bars, 50 μm. C, Representative confocal images of IF staining on cryosections of E11.5 Nkx3.2-Cre;mTmG embryos for the indicated markers. Nkx3.2-Cre-driven GFP expression is exclusive to mesenchymal cells in the pancreatic microenvironment. Boxed areas are shown at higher magnification and as split channels on the right. D, Representative confocal images of IF staining on cryosections of E11.5 Nkx2.5-Cre;mTmG embryos for the indicated markers. Nkx2.5-Cre-driven GFP expression marks a subset of pancreatic mesenchymal cells, positioned on the left-lateral side of the dorsal pancreas. Boxed areas are shown at higher magnification and as split channels on the right. mes, mesenchyme; pa, pancreas. Asterisks (*) indicate Pecam1-positive cells that are mG-negative. n = 3 independent embryos of each genotype were examined for each IF combination. Scale bars, 50 μm.

