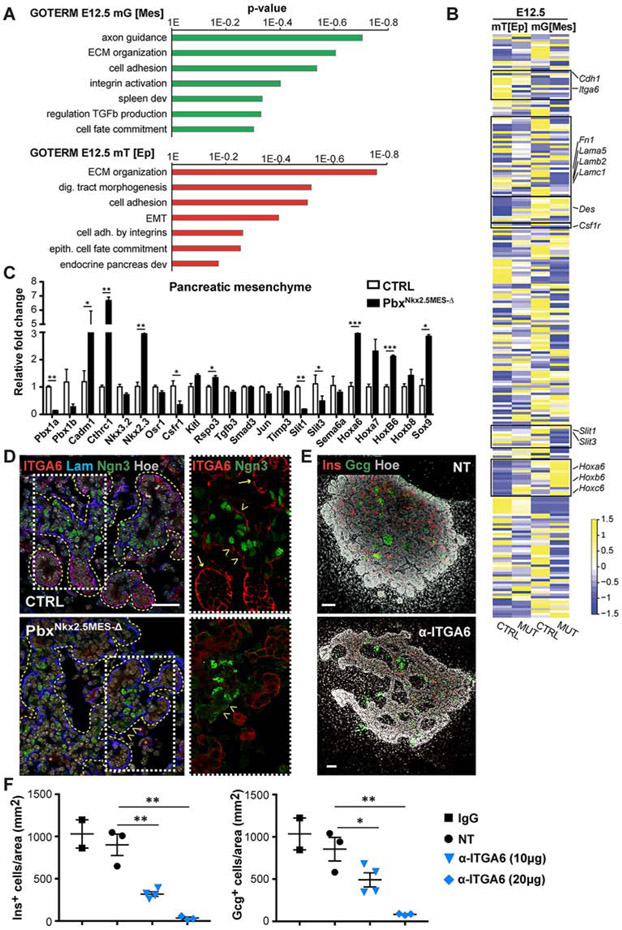
Figure 4. Defining Pbx-dependent regulatory networks in the Nkx2.5+ pancreatic mesenchyme.
A, Gene Ontology (GO) biological process terms significantly enriched in differentially expressed genes (p<0.05) between E12.5 CTRL and mTmG;PbxNkx2.5MES-Δ (MUT) RNA-Seq datasets. RNA-Seq was performed on FACS-sorted mG+ and mT+ fractions from mTmG;Nkx2.5-Cre CTRL and mTmG;PbxNkx2.5MES-Δ (MUT) pancreata. The recombined mG+ fraction is referred to as mesenchyme [Mes] and the nonrecombined mT+ as epithelial [Ep], being strongly enriched of epithelial and pancreatic marker genes (see Figures S5B, C). n=5 embryonic pancreata per genotype were pooled for FACS/RNASeq. B, Heatmap of a subset of differentially expressed genes within the mT+ [Ep] epithelial and mG+ [Mes] compartments of CTRL and mTmG;PbxNkx2.5MES-Δ (MUT) pancreata at E12.5. Colors represent high (yellow) or low (blue) expression values based on Z-score normalized FPKM values for each gene (Supplemental Table 1). Boxes highlight gene sets validated by either RT-qPCR or IF analyses. C, RT-qPCR validation analysis of indicated marker genes on mG+ mesenchymal fractions derived from E12.5 CTRL and mutant embryos. Absence of Pbx1 (Pbx1a and Pbx1b isoforms) was confirmed in the PbxNkx2.5MES-Δ pancreatic mesenchyme. Data are represented as relative fold change. Values shown are mean ± s.e.m. n≥3. * p<0.05, ** p<0.01, *** p<0.001. D, IF analysis of Integrin a6 (ITGA6), Laminin (Lam), Neurogenin3 (Ngn3) on control (CTRL) and PbxNkx2.5MES-Δ E14.5 mouse pancreatic cryosections. Boxed area are shown at higher magnification on the right, displaying ITGA6 (Red) and Ngn3 (Green) channels. Yellow dashed lines mark pancreatic epithelium. Arrows indicate acinar structures; arrowheads indicate trunk regions. Scale bar, 50 μm. E, Whole-mount IF analysis of Glucagon (Gcg) and Insulin (Ins) on mouse pancreatic explants treated for 3 days with blocking antibodies against Integrin α6 (α-ITGA6) or left untreated as controls (NT). Hoechst (Hoe), nuclear counterstain. Scale bars, 100 μm. F, Quantification of Insulin+ and Glucagon+ cells in pancreatic explants after 3 days in culture with indicated doses of α-ITGA6 blocking antibody. Nontreated (NT) and Immunoglobulin G (IgG)-treated samples were used as controls. Cell counts were normalized to the average Ecad+ epithelium area (mm2). n=2 (IgG), n=3 (NT), n=4 (α-ITGA6 10μg), n=3 (α-ITGA6 20 μg) explants. * p<0.05, ** p<0.01; two-tailed paired t-tests.

