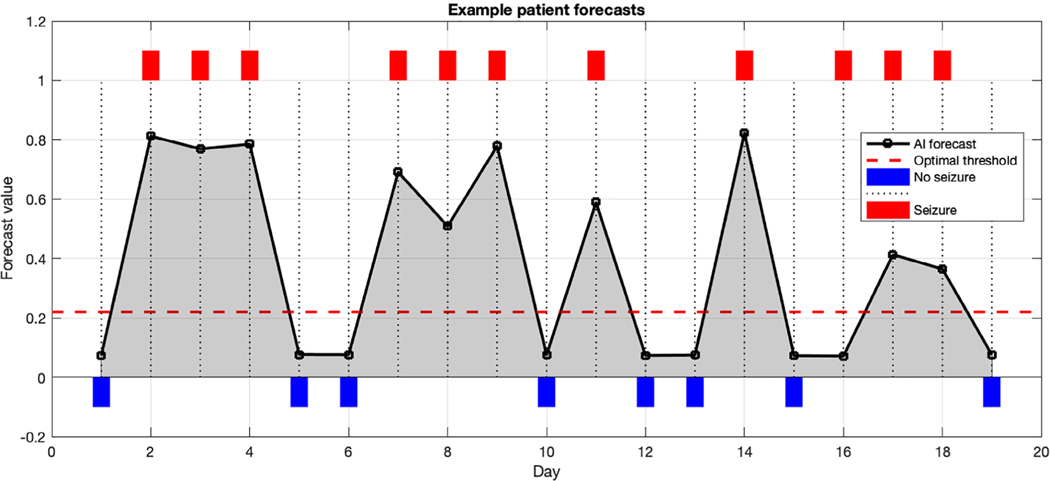
FIGURE 4:
Example patient diary. Shown here is a 19-day diary excerpt from one patient. The black line indicates the forecasts from each day. Red rectangles indicate seizure days, whereas blue rectangles indicate nonseizure days. The red dashed line shows the threshold that this particular patient can optimally use as a cutoff (based on the receiver operating characteristic over this patient’s entire 96-day diary). Optimal threshold was selected by finding the threshold that optimally trades off sensitivity and specificity. As seen here, most seizure days have forecasts above the optimal threshold, and most nonseizure days have forecasts below. AI = artificial intelligence.

