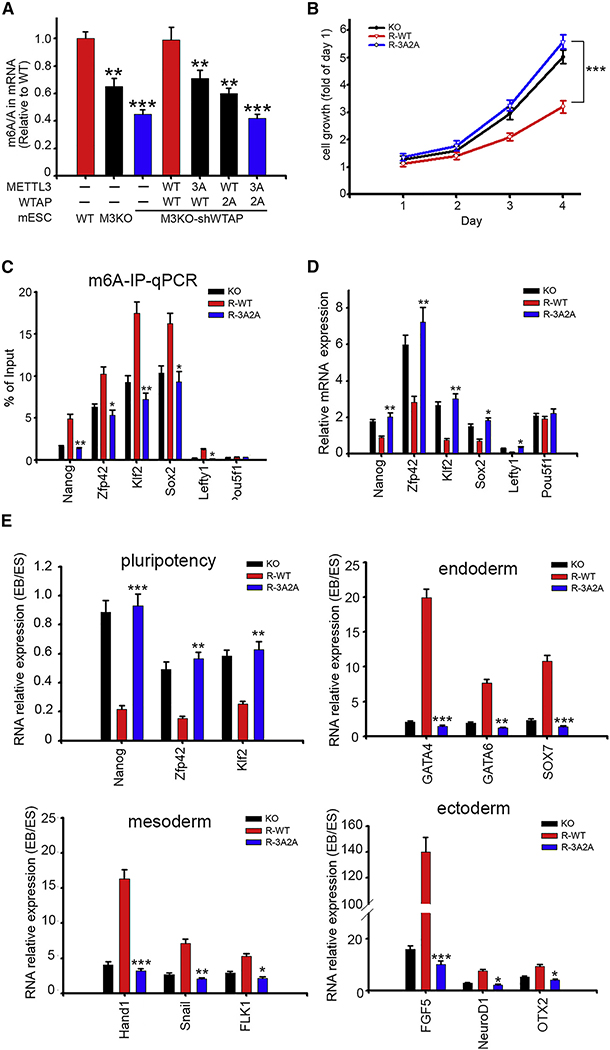
Figure 4. Phosphorylation of METTL3/WTAP by ERK Facilitates Resolution of Pluripotency.
(A) LC-MS/MS quantification of the m6A/A ratio in mRNA of mESCs stable transfectants. *p < 0.05, **p < 0.01, ***p < 0.001.
(B) Cell growth of R-WT and R-3A2A mESCs were measured by sulforhodamine B dye (SRB assay). Data are presented as relative to Day 1. ***p < 0.001.
(C) MeRIP-qPCR of pluripotency transcripts in mESCs stable transfectants. *p < 0.05, **p < 0.01.
(D) qPCR analysis of pluripotency genes in mESCs stable transfectants. *p < 0.05, **p < 0.01. (E) qPCR analysis for pluripotency and differentiation markers expression after 8 days of embryonic body induction. *p < 0.05, **p < 0.01, ***p < 0.001.
Unless otherwise indicated, all data in this figure contain n = 3 replicates per group, and represent mean ± SEM. All p-values were also calculated by Student’s t test.
See also Figure S5.

