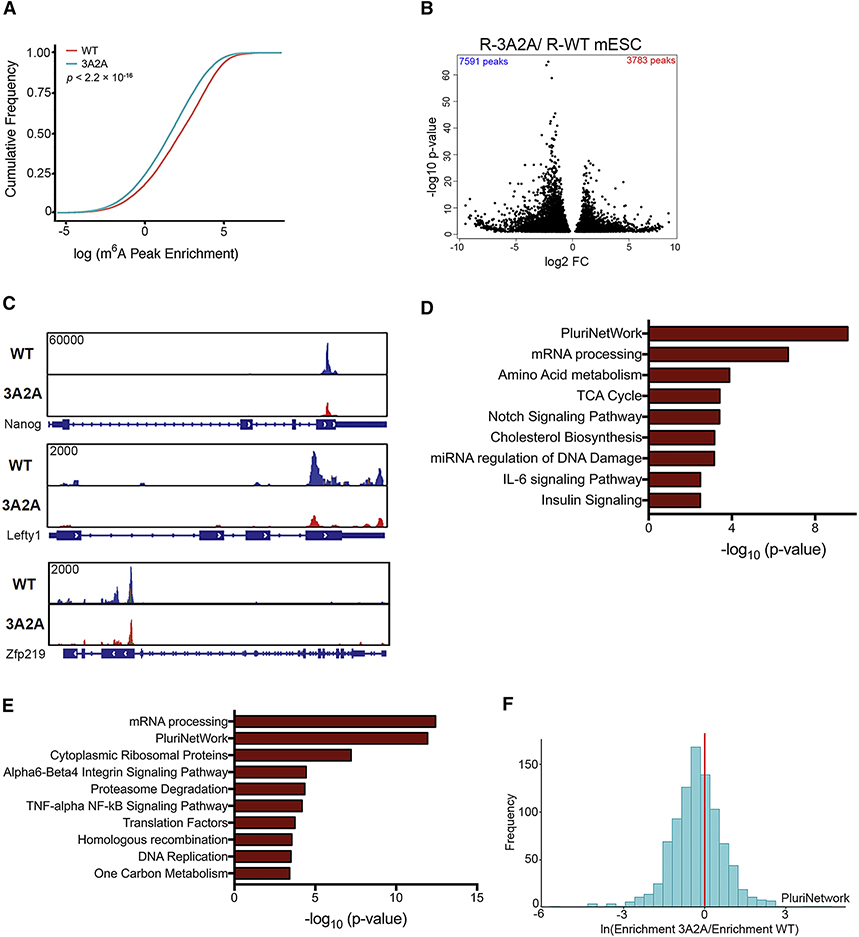
Figure 5. Transcripts Affected by Phosphorylation of Methyltransferase Complex in mESCs.
(A) Cumulative distribution function of log2 peak intensity of m6A-modified sites in R-WT and R-3A2A mESCs.
(B) Volcano plot for peaks with differential m6A intensity between R-WT and R-3A2A mESCs. Fold change (FC) is the ratio of IP over Input for R-WT and R-3A2A.
(C) Coverage plots of the m6A peaks of Nanog, Lefty1, and Zfp219 comparing R-WT and R-3A2A mESCs. Plotted coverages are the medians of three replicates.
(D) Gene enrichment analysis with WikiPathway terms of differentially m6A methylated peaks in R-WT and R-3A2A mESCs for molecular functions.
(E) Gene enrichment analysis with WikiPathway terms of differentially expressed genes (p < 0.05).
(F) A histogram showing relative m6A peak enrichment of R-3A2A compared to R-WT mESCs, indicating higher m6A methylation in pluripotency genes (PluriNetwork) for R-WT mESCs.

