
Figure 2.
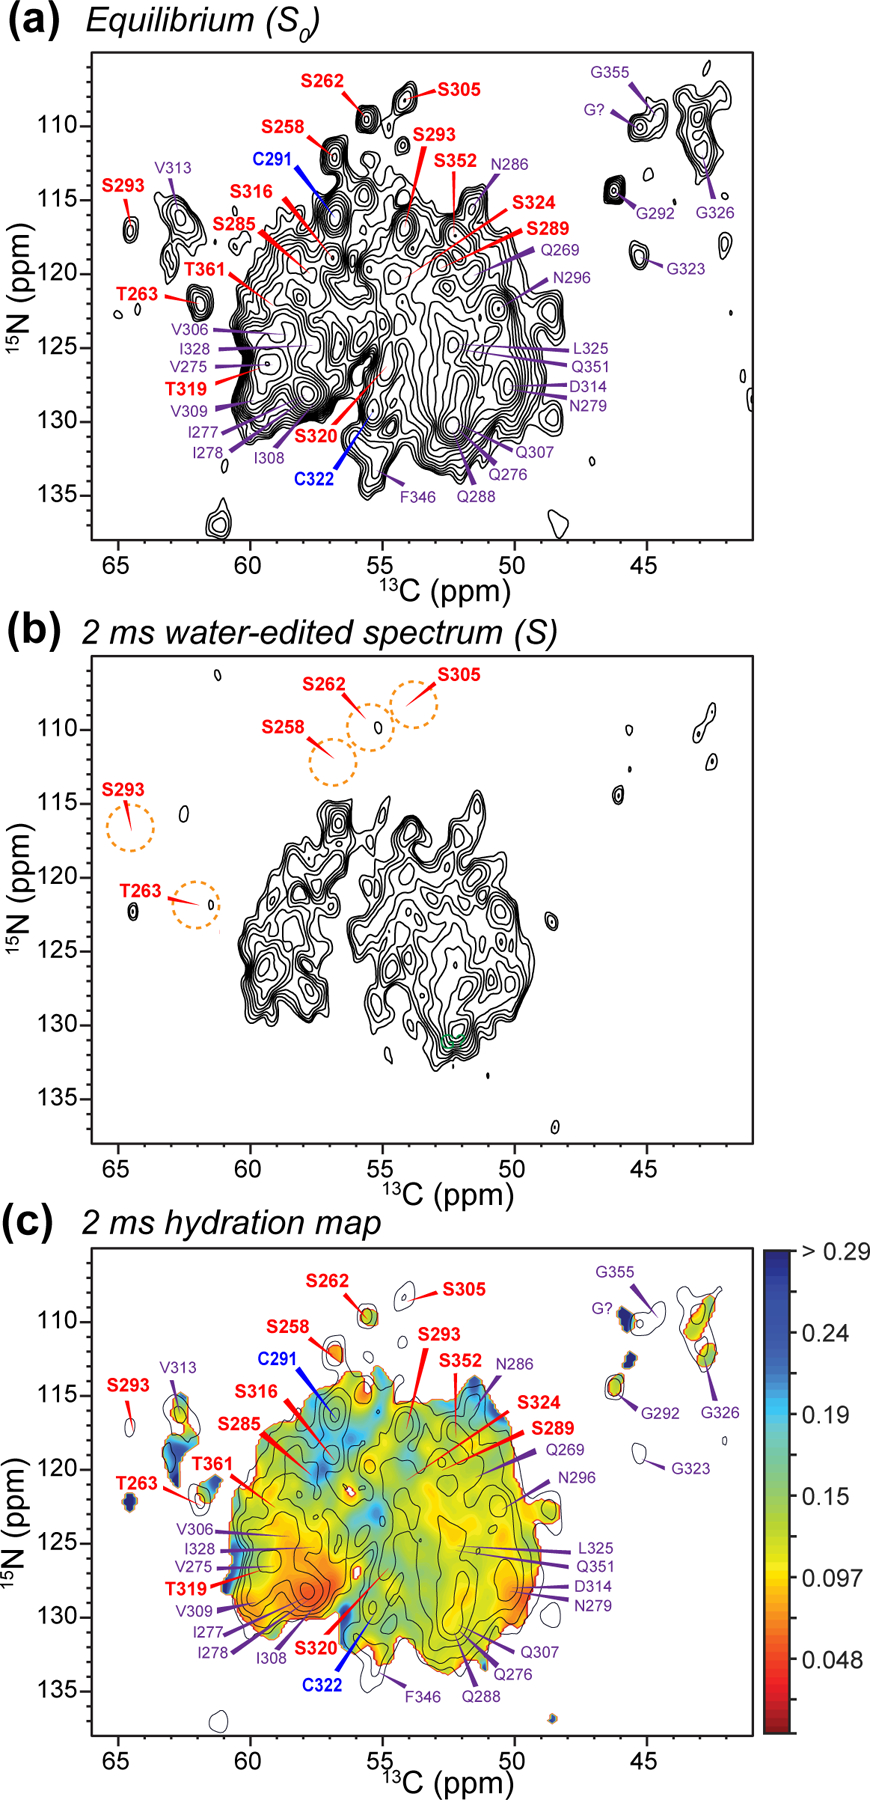
Water-edited 2D 15N-13C correlation spectra. (a) Equilibrium 2D spectrum, with assignments obtained from previous 3D NCC correlation spectra (Fig. S3). Ser, Cys, and other selected residues are assigned in red, blue, and purple, respectively. (b) 2 ms water-edited spectrum. (c) Hydration map (pointwise S/S0 values) for the 2 ms data, overlaid with the equilibrium spectrum, which is plotted with only half the number of contour levels as in (a) for clarity.