
Figure 3.
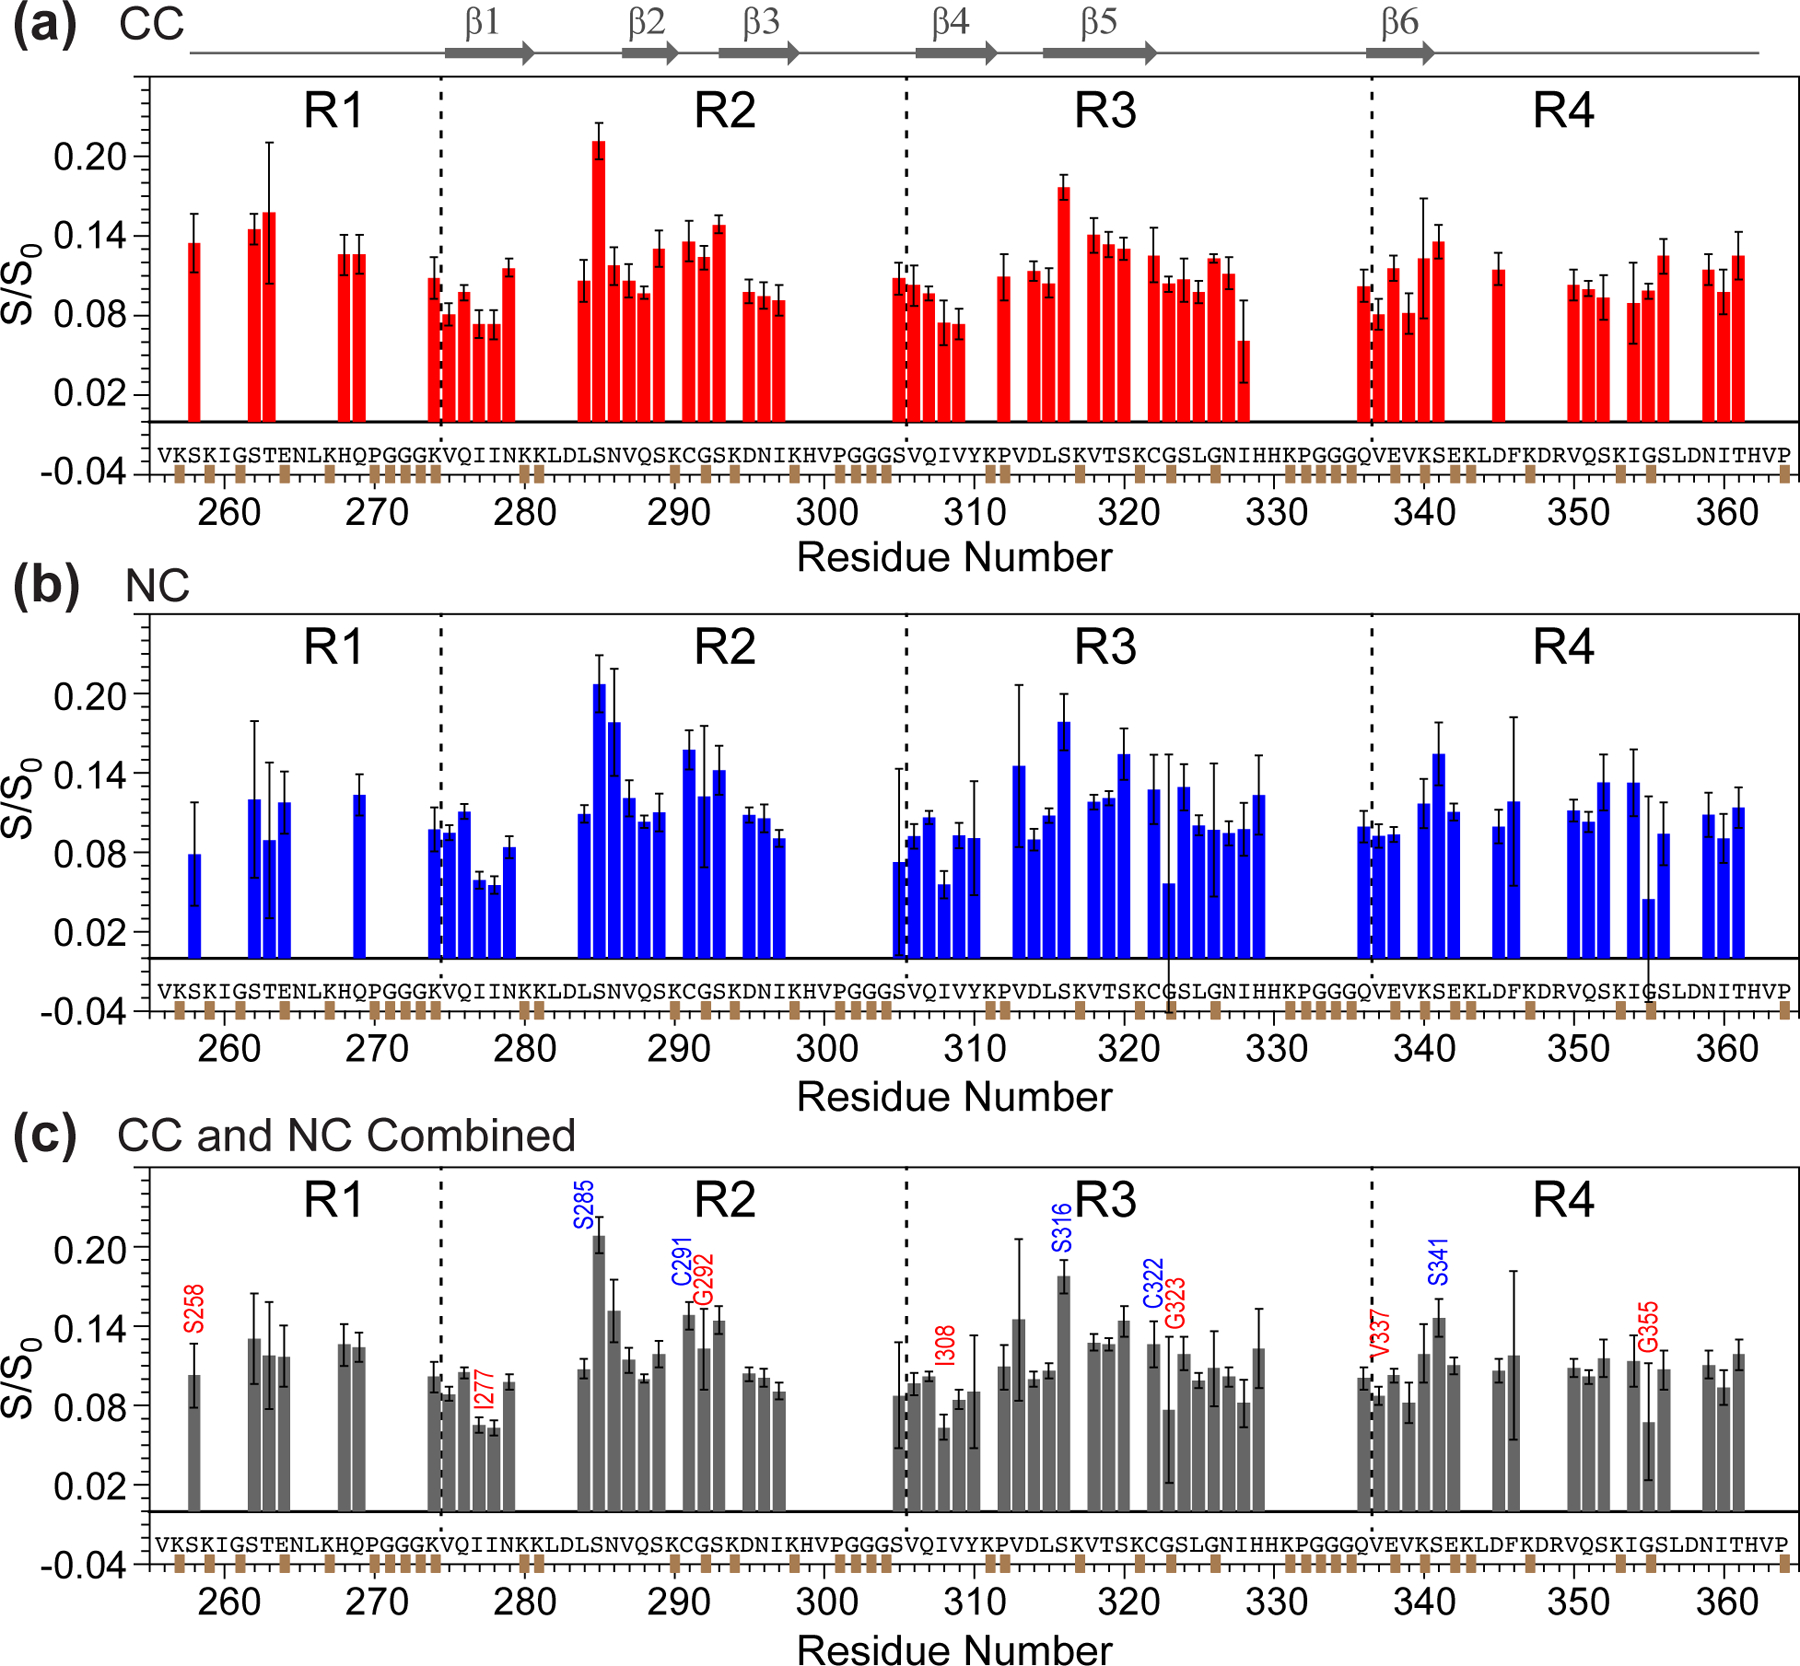
Residue-specific water accessibilities from 2D 13C-13C and 15N-13C correlation spectra. (a) Water accessibility obtained from the 2 ms and 4 ms 2D CC data. The Cα-Cβ and Cβ-Cα intensity values are averaged. The 4 ms S/S0 values were scaled to match the 2 ms S/S0 value. Thus, the bars reflect effective hydration at 2 ms. (b) Water accessibility obtained from the 2 ms N-Cα correlation spectra. (c) Combined water accessibility values at 2 ms, obtained from a weighted average of the 2D CC and NC data. Representative residues with high hydration are indicated in blue, whereas residues with low hydration are indicated in red.