
Figure 5.
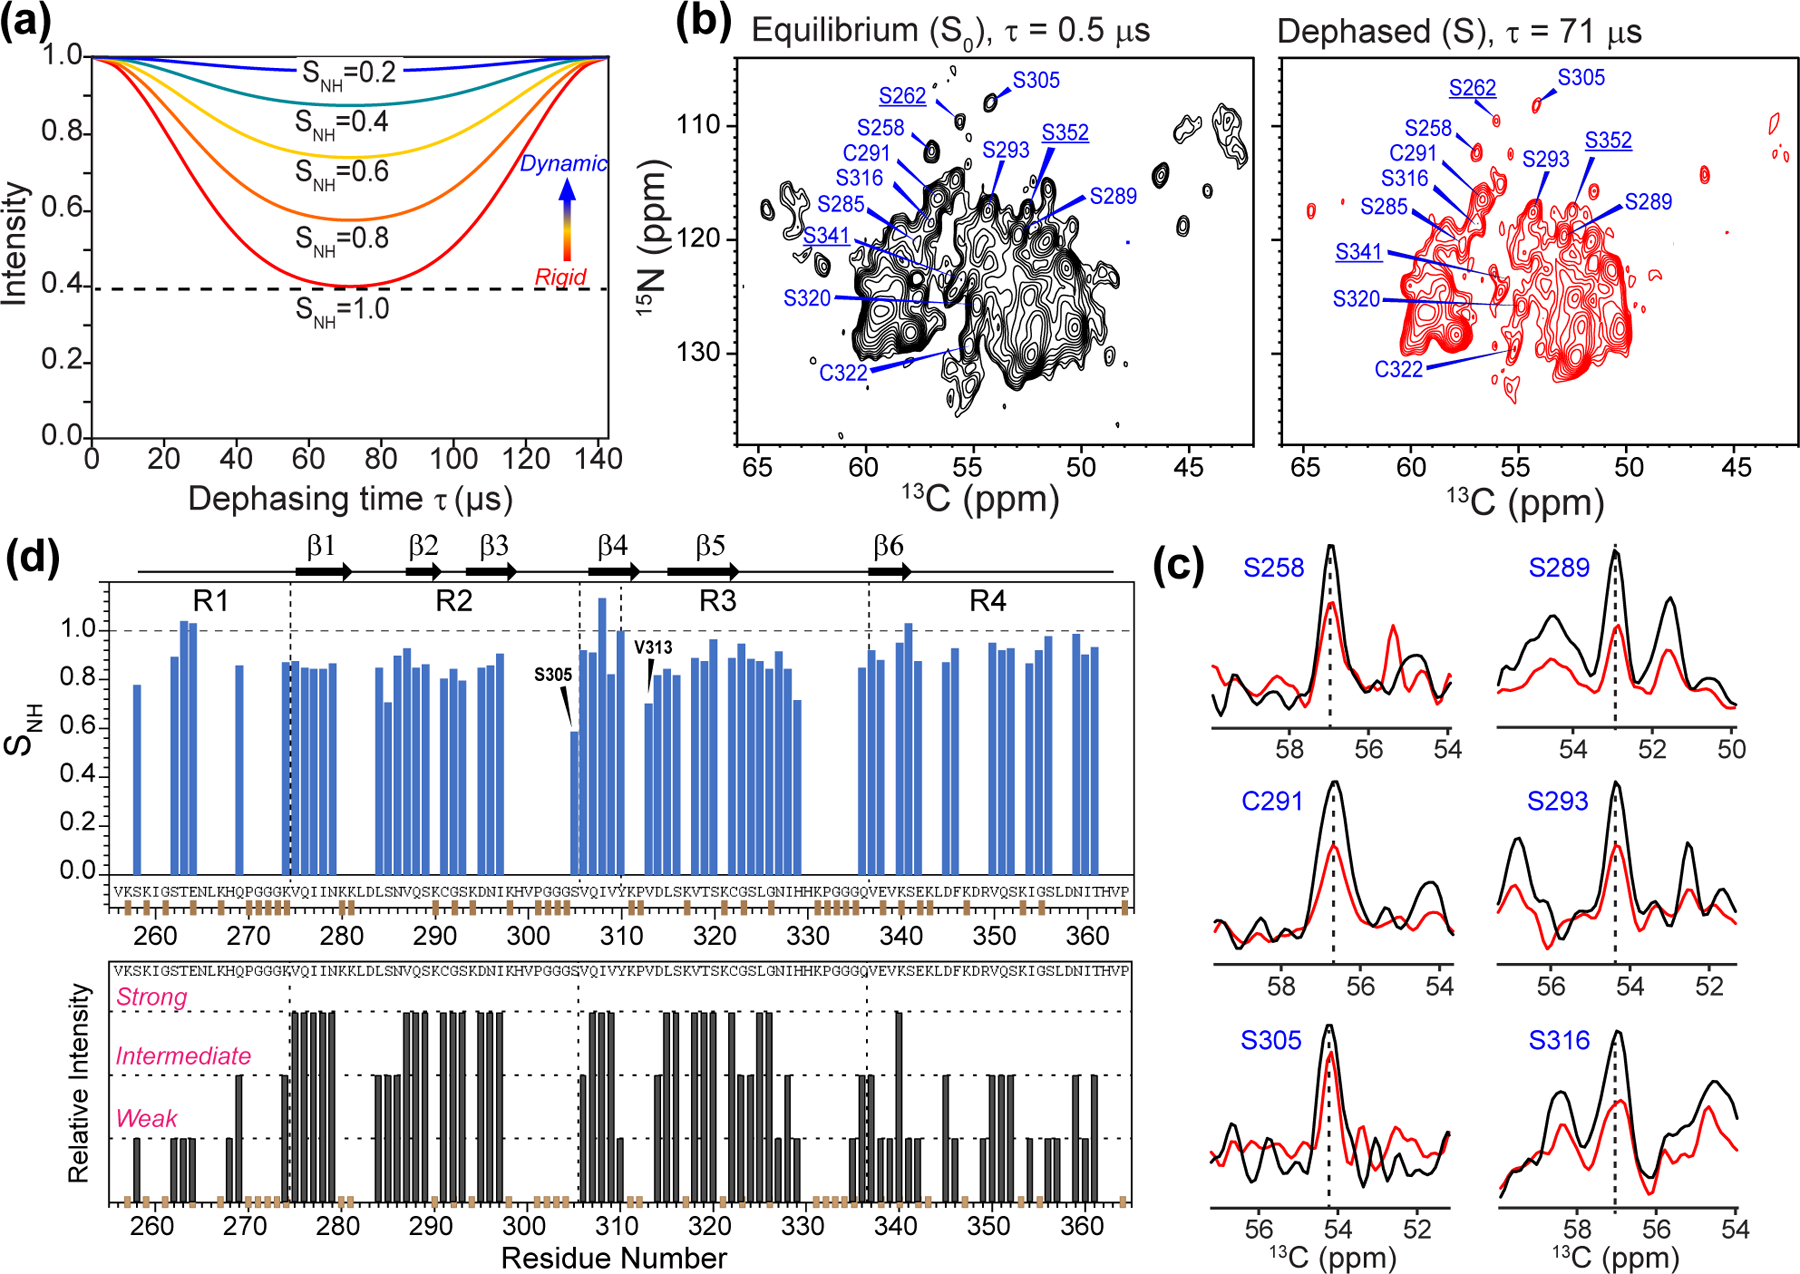
Mobility of 0N4R tau from site-resolved N-H dipolar couplings. (a) Simulated N-H doubled DIPSHIFT curves under 7 kHz MAS for a range of order parameters. The rigid-limit dipolar coupling is 12.1 kHz after accounting for FSLG scaling of 0.577 and doubling due to doubled DIPSHIFT. (b) 2D 15N-13C correlation spectra without N-H dipolar dephasing and with half of a rotor period of dipolar dephasing. The spectra were measured under 7 kHz MAS. For clarity, only Ser and Cys residues are assigned. Underlined residues are from the R1 and R4 domains that show significant dipolar dephasing, indicating that they are rigid. (c) Selected 1D cross sections from the control (black) and dipolar-dephased (red) spectrum. More mobile residues such as S305 show less dipolar dephasing. (d) N-H dipolar order parameters obtained from the DIPSHIFT spectra. Interestingly, R4 residues show large SNH values, indicating that the CP-detected R4 residues are well ordered. For comparison, the previously reported site-resolved peak intensities from 3D NCC spectra are shown below.19 Many R1 and R4 residues that show weak intensities in the 3D correlation spectra display high N-H order parameters.