
Figure 5:
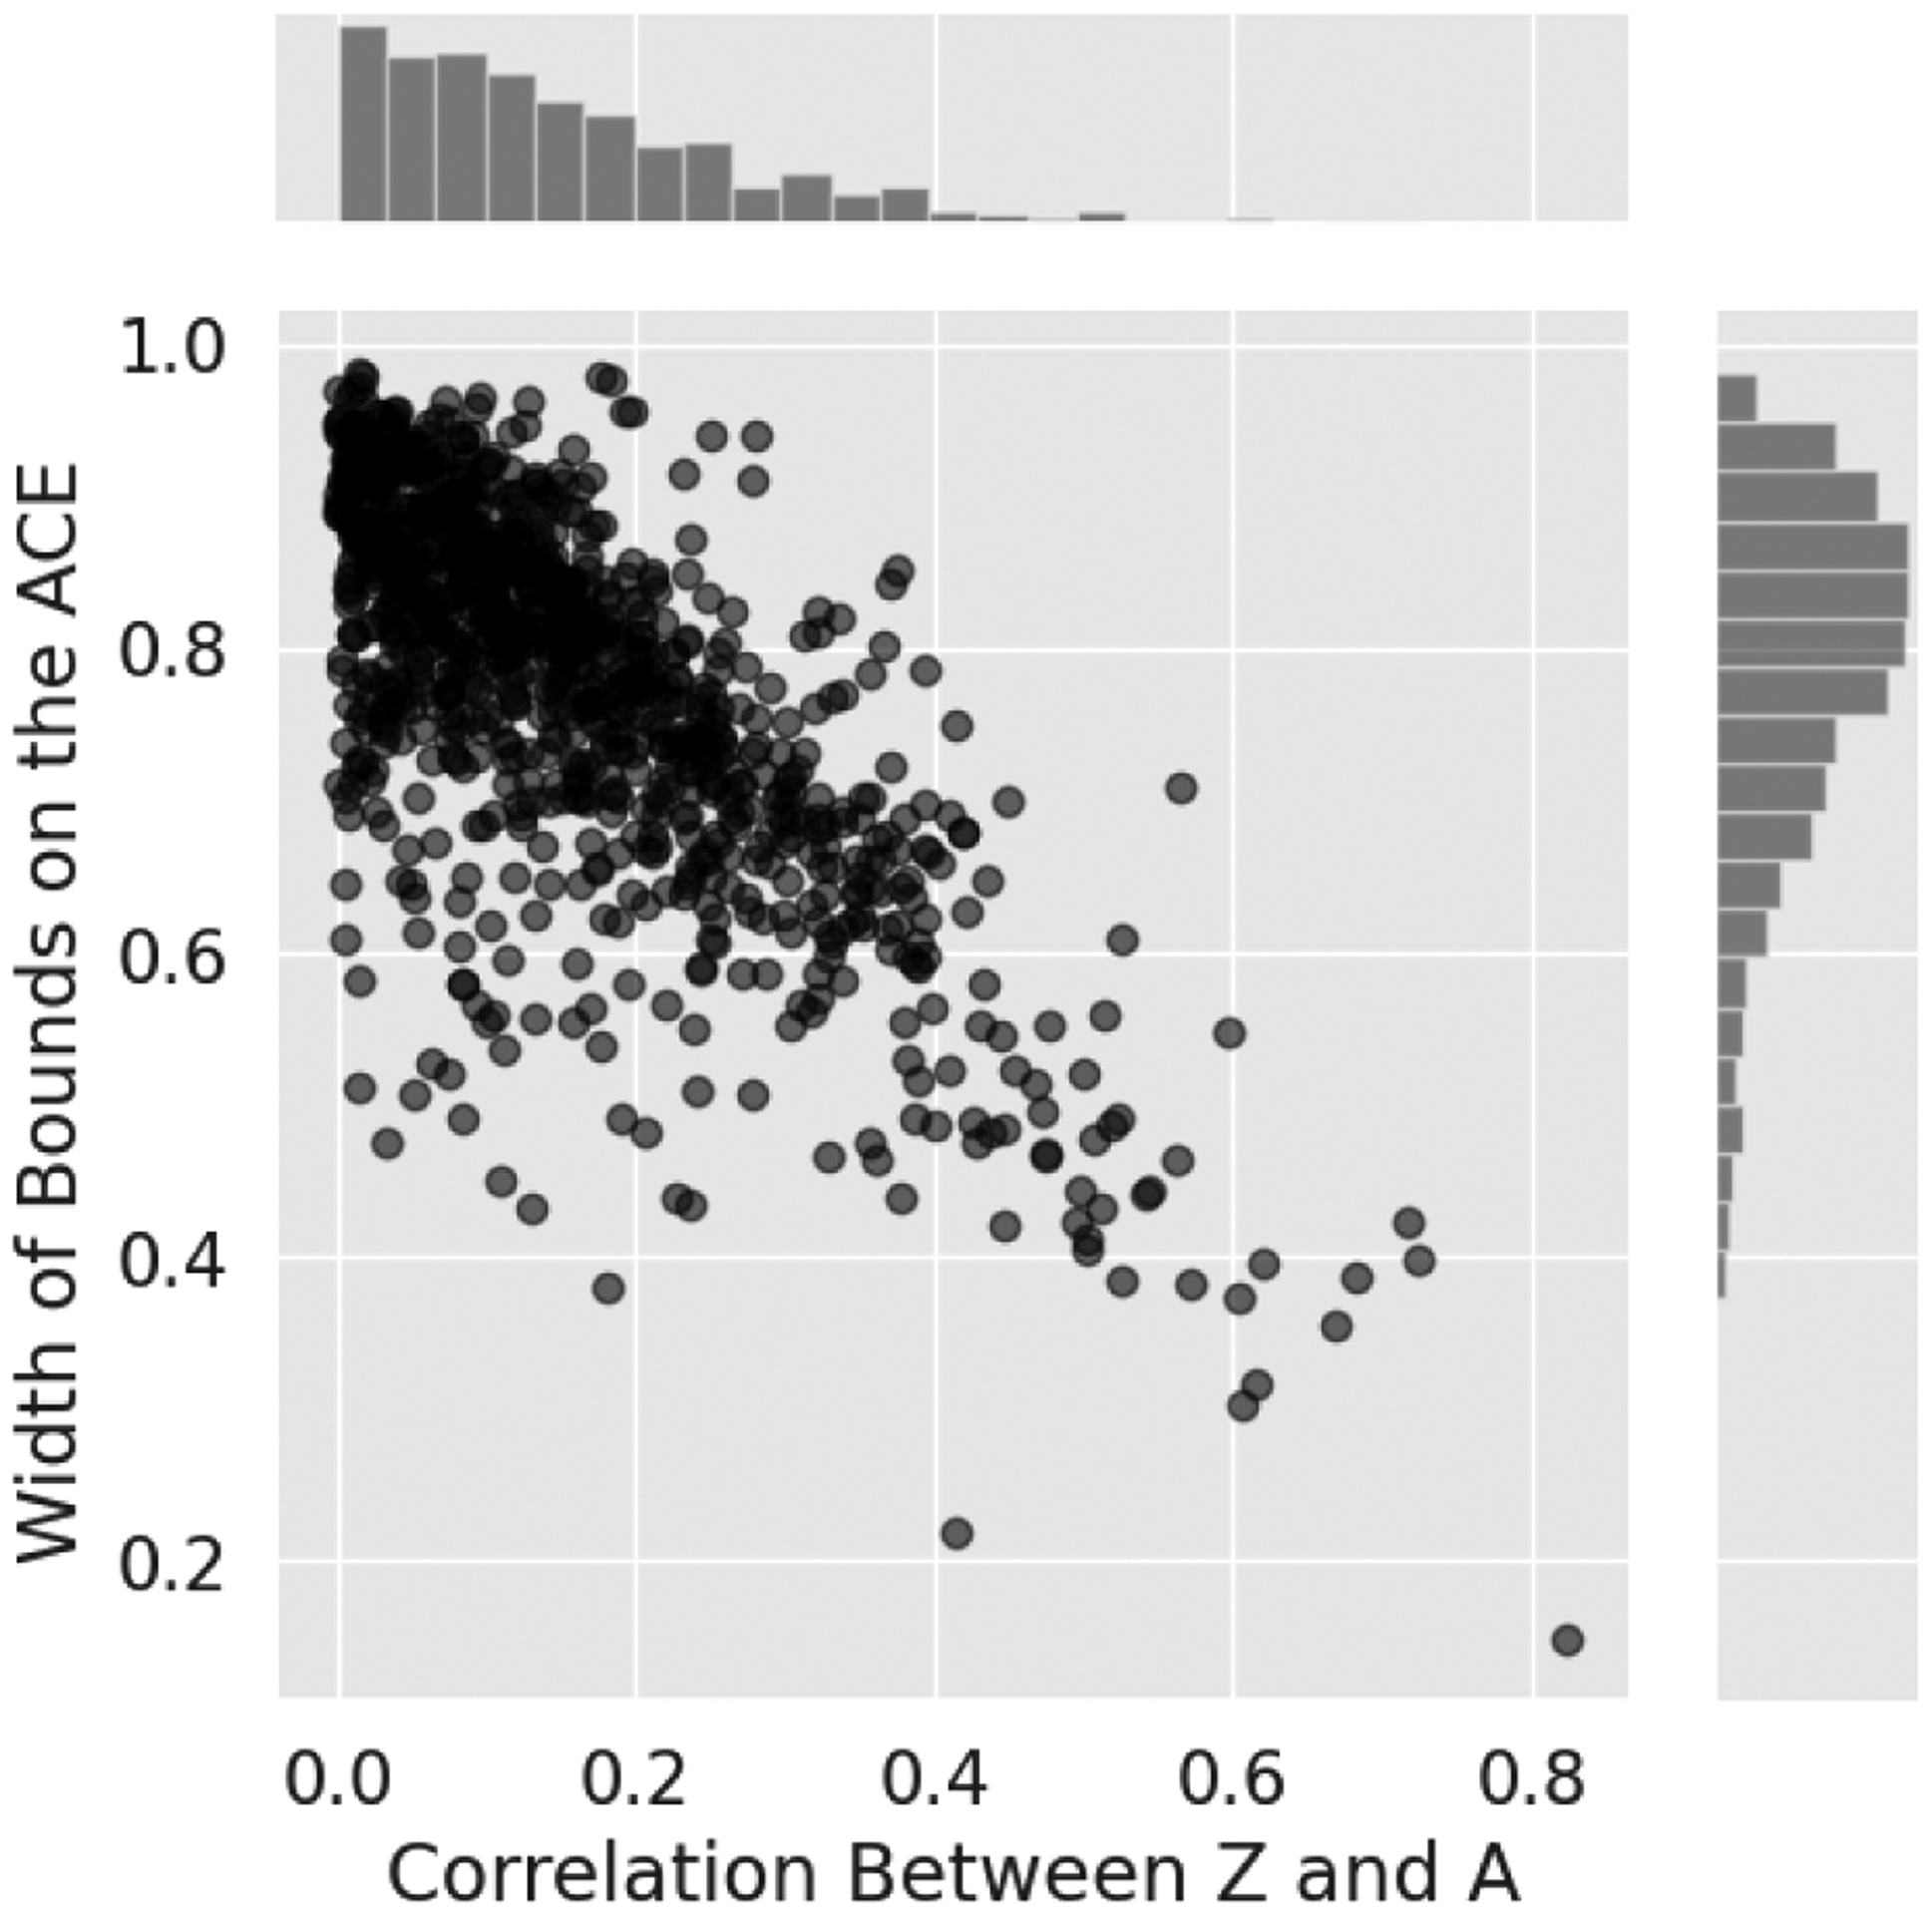
Each point represents a randomly generated distribution in the IV model with covariates, depicted in Fig. 3 (a). This plot shows informally that correlation between the generalized instrument Z and the treatment A is associated with tighter bounds on the ACE, E[Y(A = 1) − Y (A = 0)]. The histograms show the marginal distributions of correlation and bound width.