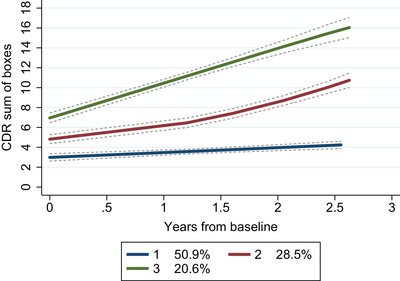
FIGURE 1.

Trajectory groups of the patients based on change in Clinical Dementia Rating scale. Note: Group‐based trajectory modeling, with the trajectory shapes 1 2 1 (1 = linear‐ and 2 = quadratic shape). Group 1 (blue); number of patients (N) = 118, posterior probability of group membership = 0.94 and odds of correct classification = 15.2. Group 2 (red); N = 63, posterior probability of group membership = 0.86 and odds of correct classification = 17.0. Group 3 (green); N = 50, posterior probability of group membership = 0.91 and odds of correct classification = 37.6. The stippled lines denote the confidence intervals of the trajectory groups. Percentages are proportion of the patient population based on the maximum probability assignment rule. Abbreviation: CDR, Clinical Dementia Rating scale.
