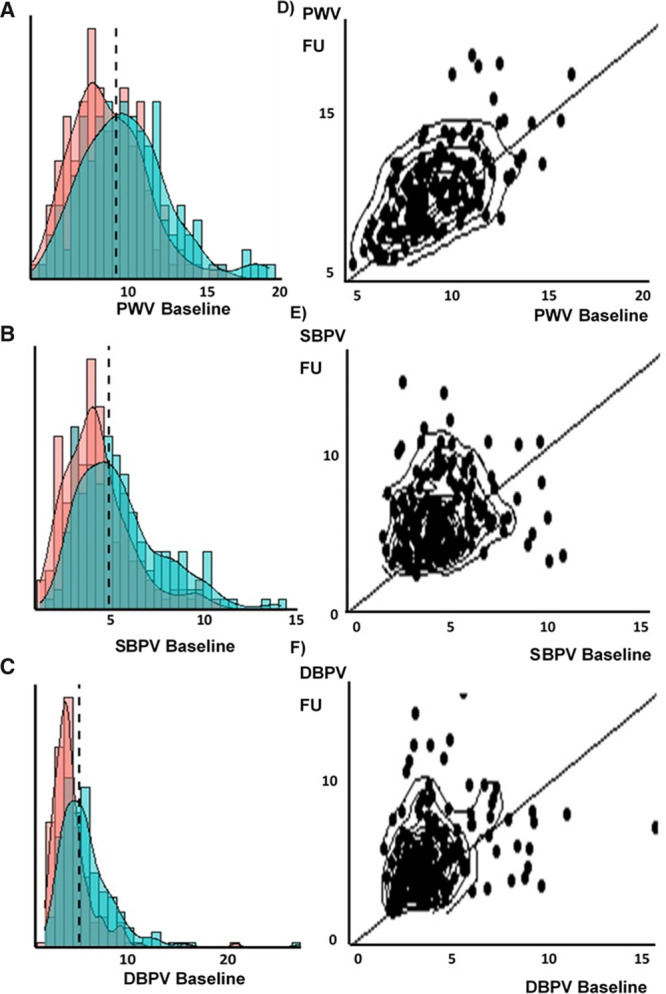
Figure 1.

Change in distribution of arterial stiffness and blood pressure variability between baseline and follow-up. A–C, The distribution of each index at baseline (red) and follow-up (blue). D–F, The correlation between baseline and follow-up as scatter plots with contour lines and lines of unity. DBPV indicates diastolic blood pressure variability; PWV, pulse wave velocity; and SBPV, systolic blood pressure variability.
