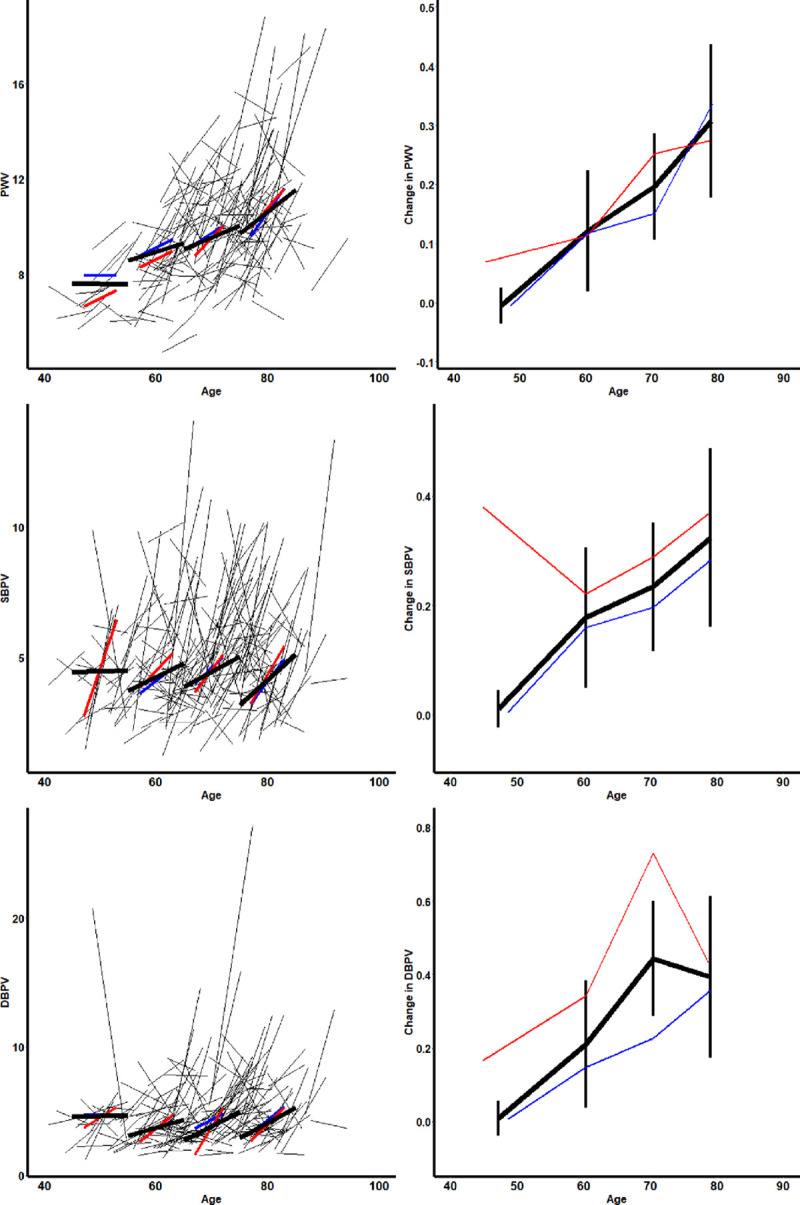
Figure 2.

Progression of arterial stiffness and blood pressure variability by age and gender. A–C, Individual changes during follow-up, and summary estimates within age groups (<55, 55–65,65–75, >75), for all patients (black), for men (blue), and women (red). D–F, The average rate of progression within each age group, stratified by age, and gender, with 95% CIs for the whole population. DBPV indicates diastolic blood pressure variability; PWV, pulse wave velocity; and SBPV, systolic blood pressure variability.
