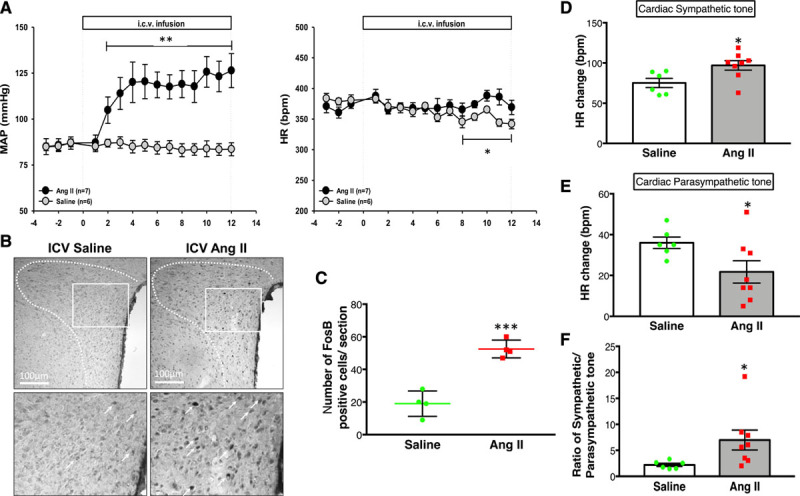
Figure 1.

Hemodynamic, neural and autonomic changes to Ang II. A, Mean arterial pressure (MAP) and heart rate (HR) measured by telemetry throughout the experiment in intracerebroventricular (ICV), saline (n=6), and Ang II (angiotensin II; n=7) infused rats. B, Representative digital images of FosB (Proto-Oncogene) staining in saline- and Ang II-infused rats. Each pair of saline- and Ang II-infused images were adjusted for uniform brightness and contrast; scale bar=100 μm, (C) the mean number of FosB-positive cells in the paraventricular nucleus of the hypothalamus. n=3–4/group. D, Cardiac sympathetic tone and (E) cardiac parasympathetic tone calculated by the changes in HR responses to methylatropine and propranolol, and (F) the ratio between these variables in the Saline (n=6) and Ang II (n=7) infused rats. T-test (with Welch correction; A, C, D, E, and F). **P=0.004, *P=0.048 (A); ***P=0.0007 (C); *P=0.021 (D); *P<0.042 (E); *P=0.042 (F) vs saline control.
