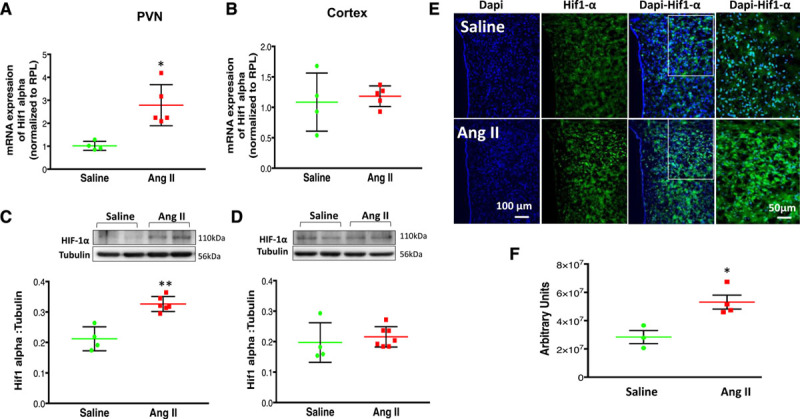
Figure 3.

Changes in HIF-1α (hypoxia-inducible factor-1α) after Ang II. A, HIF-1α mRNA expression relative to rpl19 (ribosomal protein L 19) measured by real-time PCR in the paraventricular nucleus of the hypothalamus (PVN) and (B) cortex of vehicle and Ang II (angiotensin II)-infused group. The 2−ΔΔCT method was used to calculate relative changes in gene expression, which relates the expression of the target gene to the expression of a reference gene. Changes in HIF-1α mRNA are presented in folds with reference to the Saline group. C, Protein expression of HIF-1α expression in the PVN and (D) cortex of saline and Ang II-infused group top: a representative Western blot, bottom: densitometric analyses of HIF-1α level normalized to tubulin. E, Immunofluorescent staining of PVN sections from saline and Ang II-infused rats. HIF-1α (green) and nuclei (blue). F, Average values obtained by the reciprocal intensity method in each group were shown. Values are mean±SEM of analyses of 4 to 6 animals in each group. T-test (with Welch correction [A–D], and [F]). *P=0.010 (A); P=0.0721 (B); **P=0.004 (C); P=0.0626 (D); *P=0.016 (F) vs saline control.
