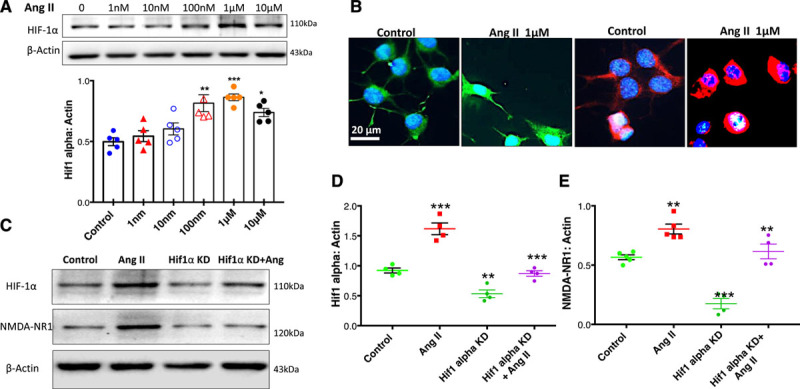
Figure 6.

Changes in expression of HIF-1α (hypoxia-inducible factor-1α) and NMDA-NR1 (N-methyl-D-aspartate NR1 receptor) after Ang II (angiotensin II) in NG108 cells. A, Western blot to assess levels of HIF-1α protein after treatment with different doses of Ang II. Top: a representative Western blot, bottom: densitometry analyses of HIF-1α level normalized to Actin, T-test (with Welch correction). **P=0.006 vs Control, ***P<0.0001 vs Control, *P=0.010 vs Control. B, Immunofluorescent staining for HIF-1α and NMDAR (N-methyl-D-aspartate [NMDA] receptor)-NMDA-type1 (NR1) after 8 h of Ang II treatment in NG108 cells. NMDA-NR1 (red), HIF-1α (green), and Nuclei (blue). C, Western blot of HIF-1α and NMDAR-NR1 expression after siRNA HIF-1α (8 pmol) knockdown (KD) and Ang II, 1 μM stimulation. D, Cumulative data of HIF-1α expression. Two-way ANOVA revealed significant interaction between effect of Ang II and HIF-1α KD (P=0.019). ***P=0.0001 Ang II vs Control, **P=0.008 HIF-1α KD vs Control, ***P=0.0001 Ang II+HIF-1α KD vs Ang II and (E) cumulative data of NMDA-NR1 expression. Two-way ANOVA revealed significant interaction between effect of Ang II and HIF-1α KD (P=0.032). **P=0.005 Ang II vs Control, ***P=0.0001 HIF-1α KD vs Control, **P=0.004 Ang II+ HIF-1α KD vs Ang II. Values were mean±SE from 4 to 6 independent experiments.
