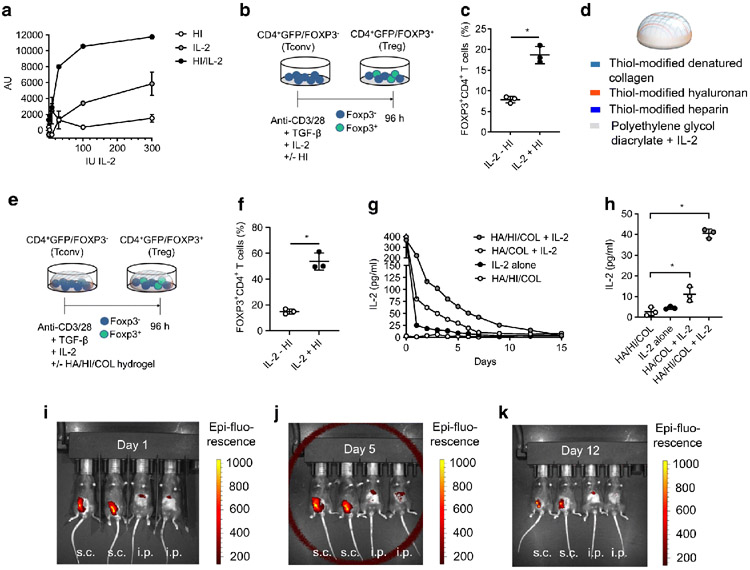
Fig. 1.
Hydrogels release IL-2 in a sustained manner and potentiate Treg induction in the presence of heparin (HI). (a) CTLL2 cells were cultured in the presence of increasing concentrations of IL-2 with or without HI. Proliferation was measured by resazurin incorporation and expressed as arbitrary units (AU). Data are shown for triplicate wells per condition. (b) Schematic of CD4+GFP/FOXP3− T cells isolated from healthy (non-diabetic) mice, cultured in the setting of anti-CD3 and anti-CD28, TGFβ and IL-2 in the absence or presence of HI. (c) Percentage of CD4+ T cells that were FOXP3+ from experiment described in (b). Quantification of n=3 identical experiments. Data represent mean ± SEM; *p<0.05 as determined by a two-sided t test. (d) Schematic of hydrogel composition. (e) Schematic of CD4+GFP/FOXP3− T cells, isolated from healthy (non-diabetic) mice cultured in the setting of anti-CD3/-CD28, TGFβ and IL-2 in the absence or presence of HI and hydrogel. COL, collagen; HA, hyaluronan. (f) Percentage of CD4+ T cells that were FOXP3+ from experiment described in (e). Quantification of n=3 identical experiments. Data represent mean ± SEM; *p<0.05 as determined by a two-sided t test. (g) Hydrogel IL-2 release curve for different hydrogel compositions (HA, HI, COL and/or IL-2). (h) IL-2 release from hydrogels measured by IL-2 ELISA at day 7. Data represent mean ± SEM; *p<0.05 as determined by ANOVA followed by Šidák’s multiple comparisons test. Data in (g) and (h) are shown for the mean of triplicate wells per condition. (i–k) Hydrogels of 50 μl volume incorporating an Alexa Fluor 790 fluorescent tag were injected into mice s.c. and i.p. and allowed to polymerise in situ. Residual hydrogel mass was then assessed at 1 (i), 5 (j) and 12 days (k) post injection using an IVIS in vivo imaging system. Data are representative of three independent experiments

