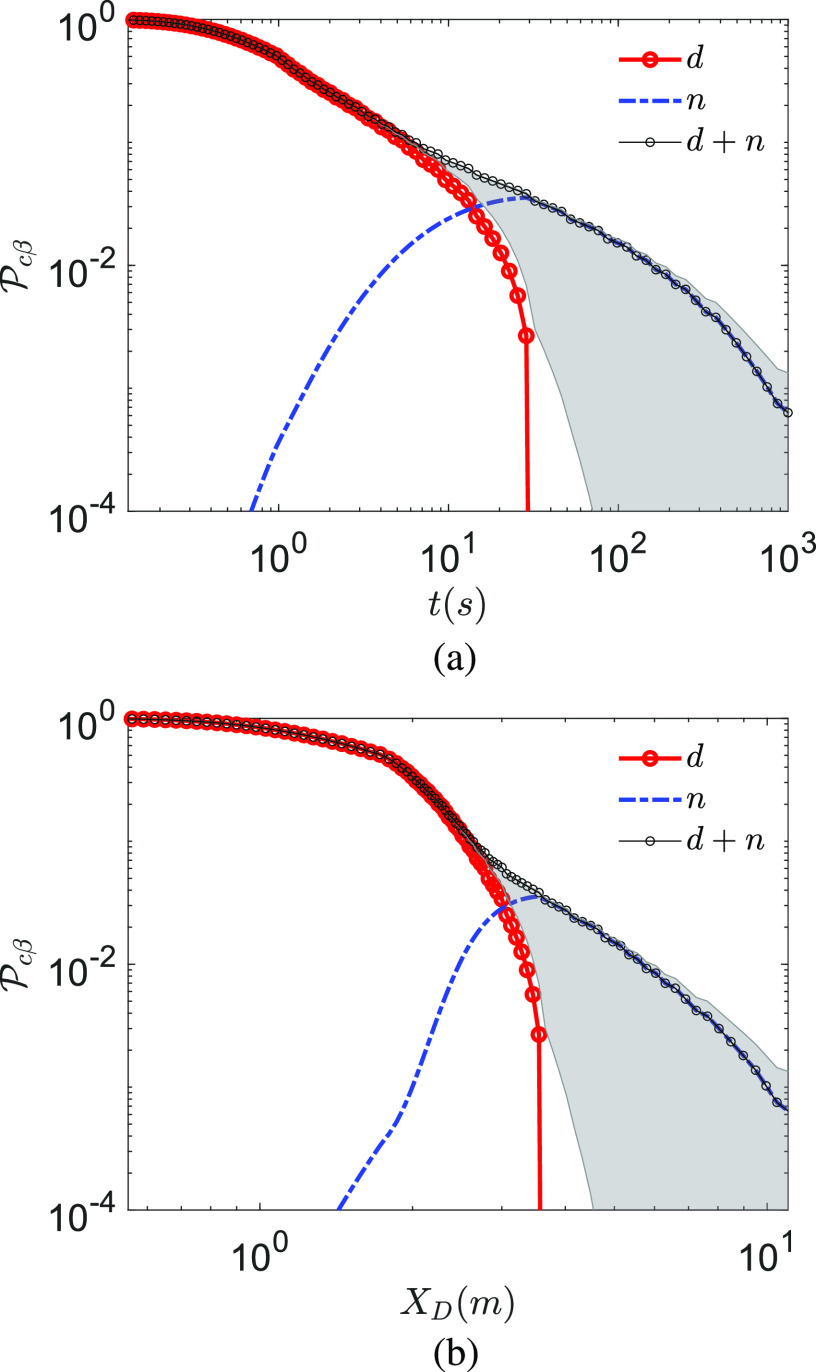
FIG. 5.
Probability of infection for droplet route d and dried droplet nuclei route n, as well as total probability for (a) as a function of time measured from the instant of the beginning of the expiratory event and (b) as a function of distance measured from the location of the origin of the expiratory event along the center of the jet/puff trajectory. T∞ = 21.44 °C and RH∞ = 50%. The bold lines represent ρv = 7 × 10⁶ copies/ml with , where min. The gray shaded region denotes the lower limit and upper limit , respectively, with .

