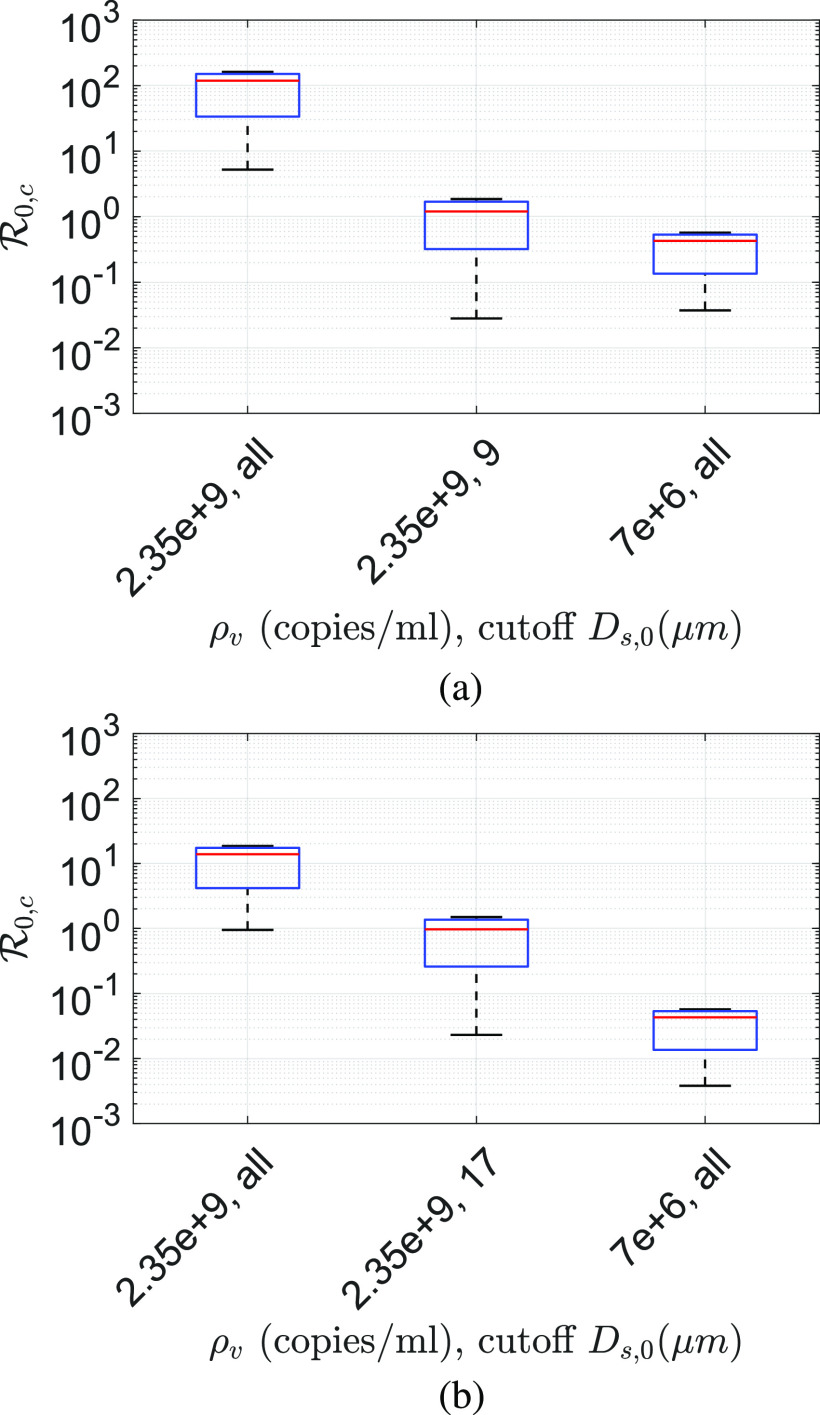
FIG. 9.
Comparison of for different conditions based on two different viral loadings ρv,maximum = 2.35 × 10⁹ copies/ml and ρv,average = 7 × 10⁶ copies/ml and if the ejection of droplets beyond the specified cutoff sizes is prevented. In each box, the red-line denotes the equal half-life condition , irrespective of the phase. The lower and upper limit corresponds to and , respectively. All data are obtained at T∞ = 21.44 °C and RH∞ = 50% and with (a) rv = 0.05 implying a minimum infectious dose of 100 virions and (b) rv = 0.005 implying a minimum infectious dose of 1000 virions.

