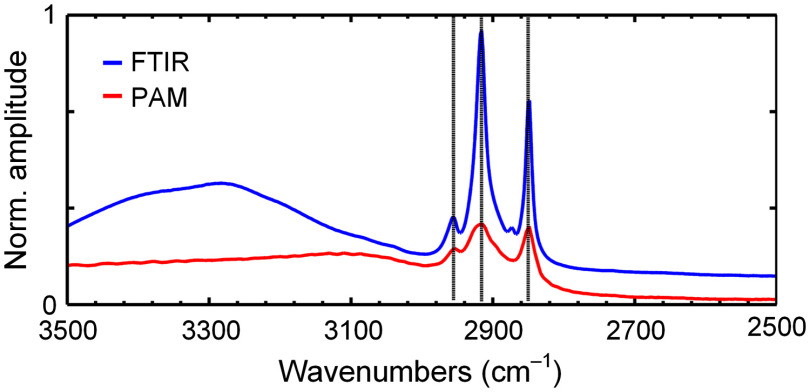
Fig. 5.
The spectrum of sphingomyelin measured by ATR-FTIR and mid-IR PAM. The vertical lines indicate the main absorption points, showing a good match between the two imaging modalities (difference ). The difference between the two spectra at may be due to the residual solvent contribution that was not completely subtracted in FTIR.

