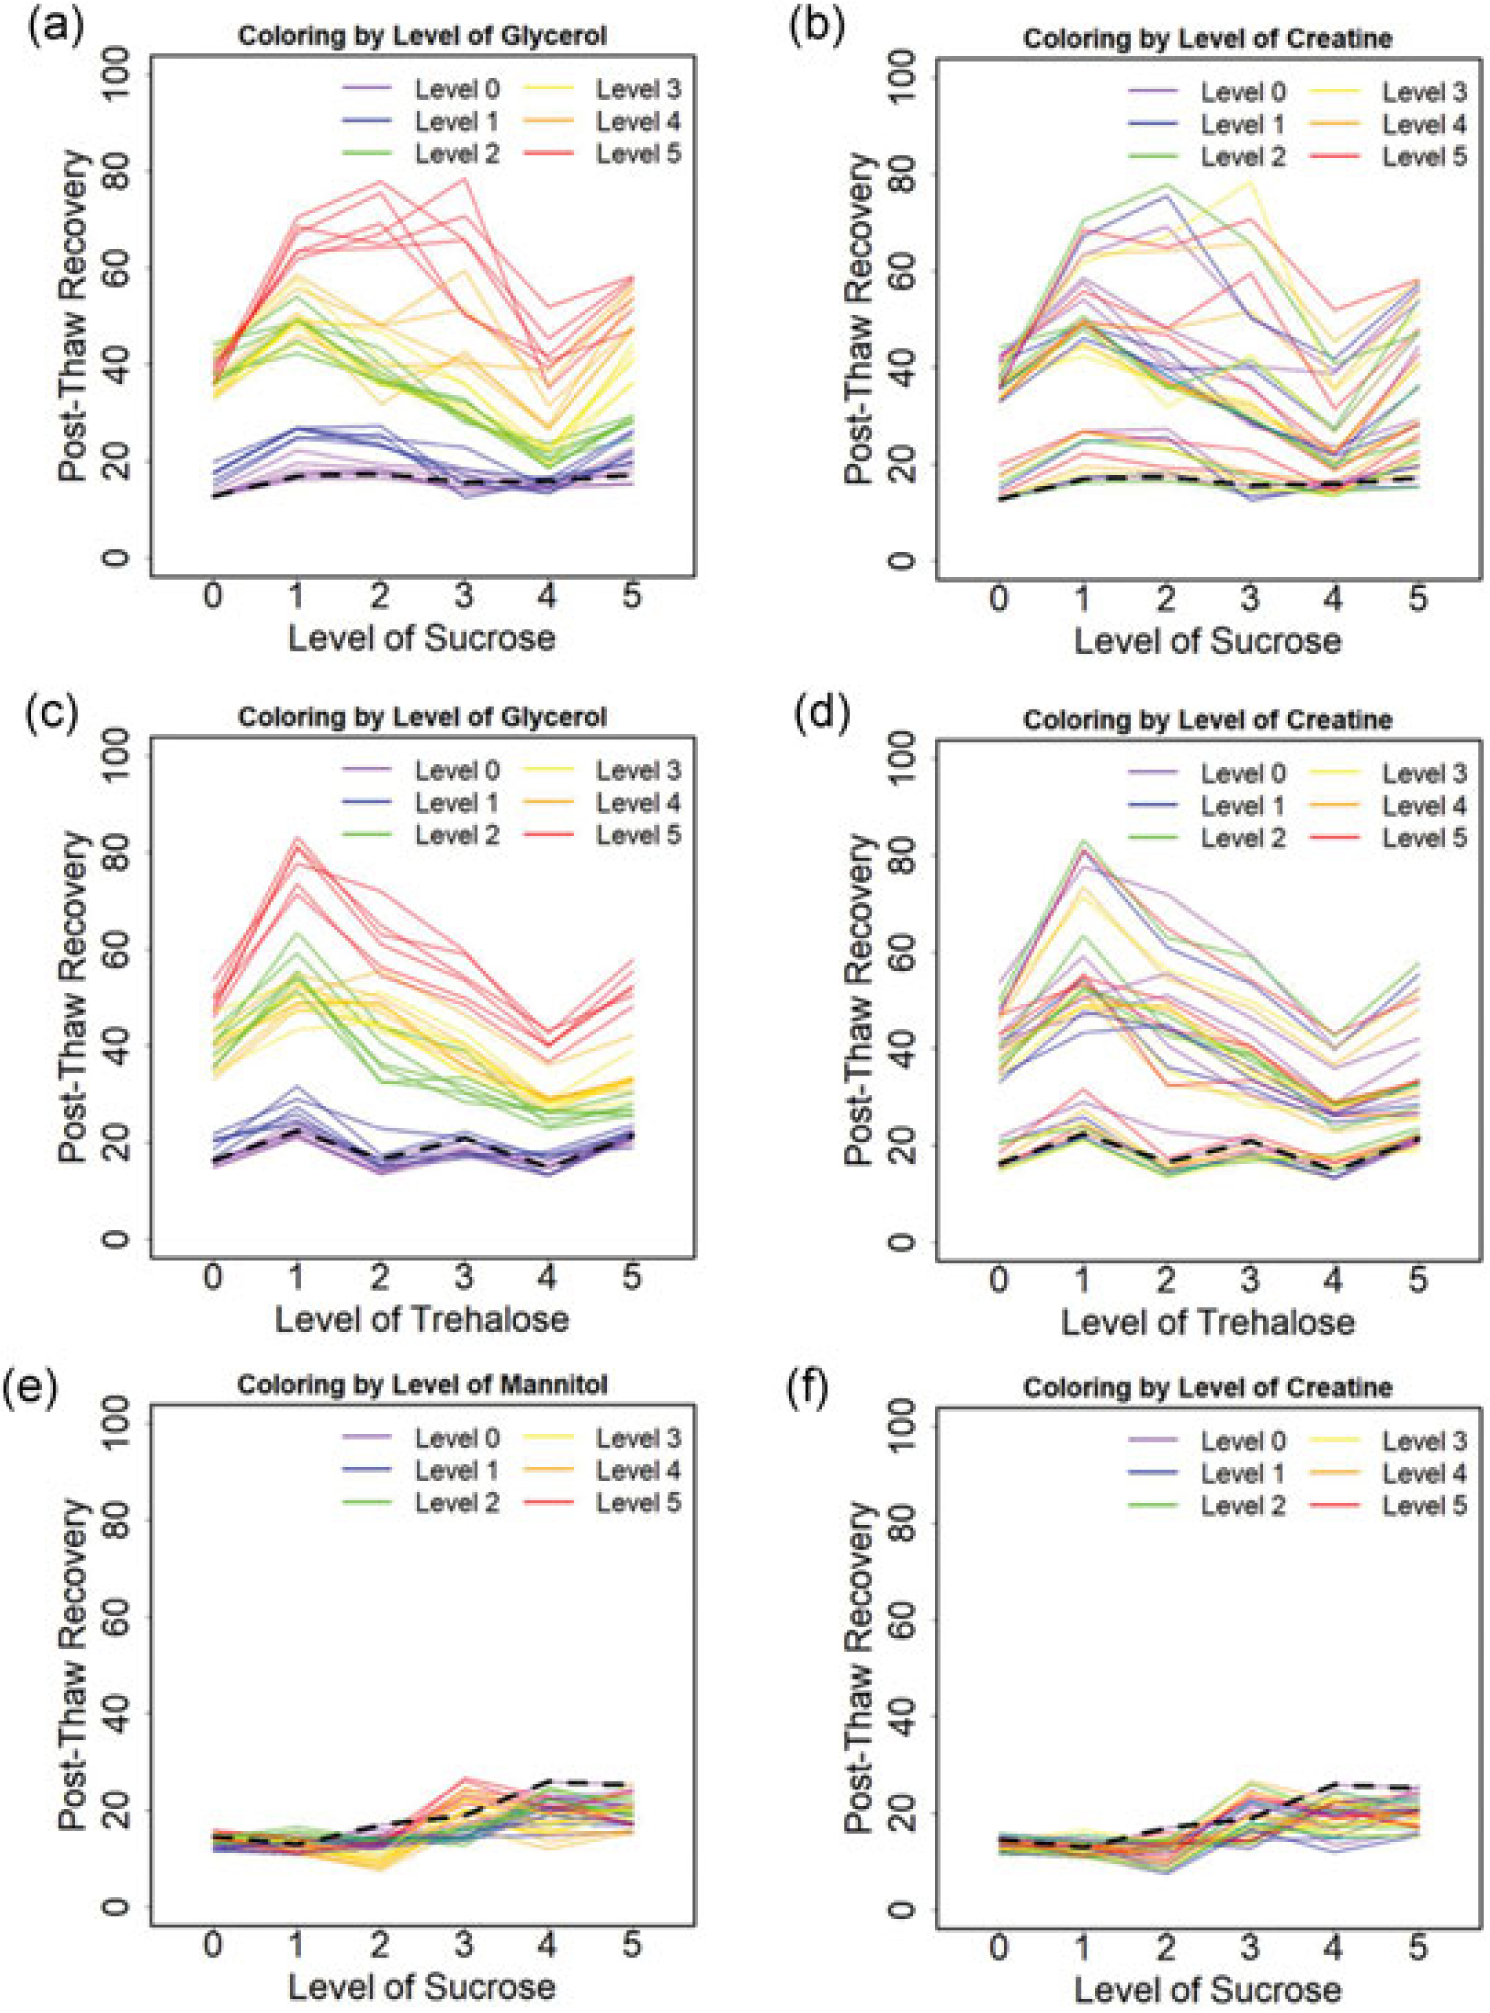
FIGURE 3.

Post-thaw recoveries of Jurkat cells cryopreserved at a cooling rate of 1°C/min for varying solution compositions: (a) the effect of sucrose with the coloring level of glycerol for SGC. (b) The effect of sucrose with the coloring level of creatine for SGC. (c) The effect of trehalose with the coloring level of glycerol for TGC. (d) The effect of trehalose with the coloring level of creatine for TGC. (e) The effect of sucrose with the coloring level of mannitol for SMC. (f) The effect of sucrose with the coloring level of creatine for SMC. Each solid line demonstrates the effect of the x-axis osmolyte on post-thaw recovery for fixed levels of the other two osmolytes. Each color represents the level of the labeled compound with all six levels of the third component shown. The dashed lines indicate the post-thaw recoveries for the single component solutions. SGC: sucrose-glycerol-creatine; SMC: sucrose-mannitol-creatine; TGC: trehalose-glycerol-creatine
