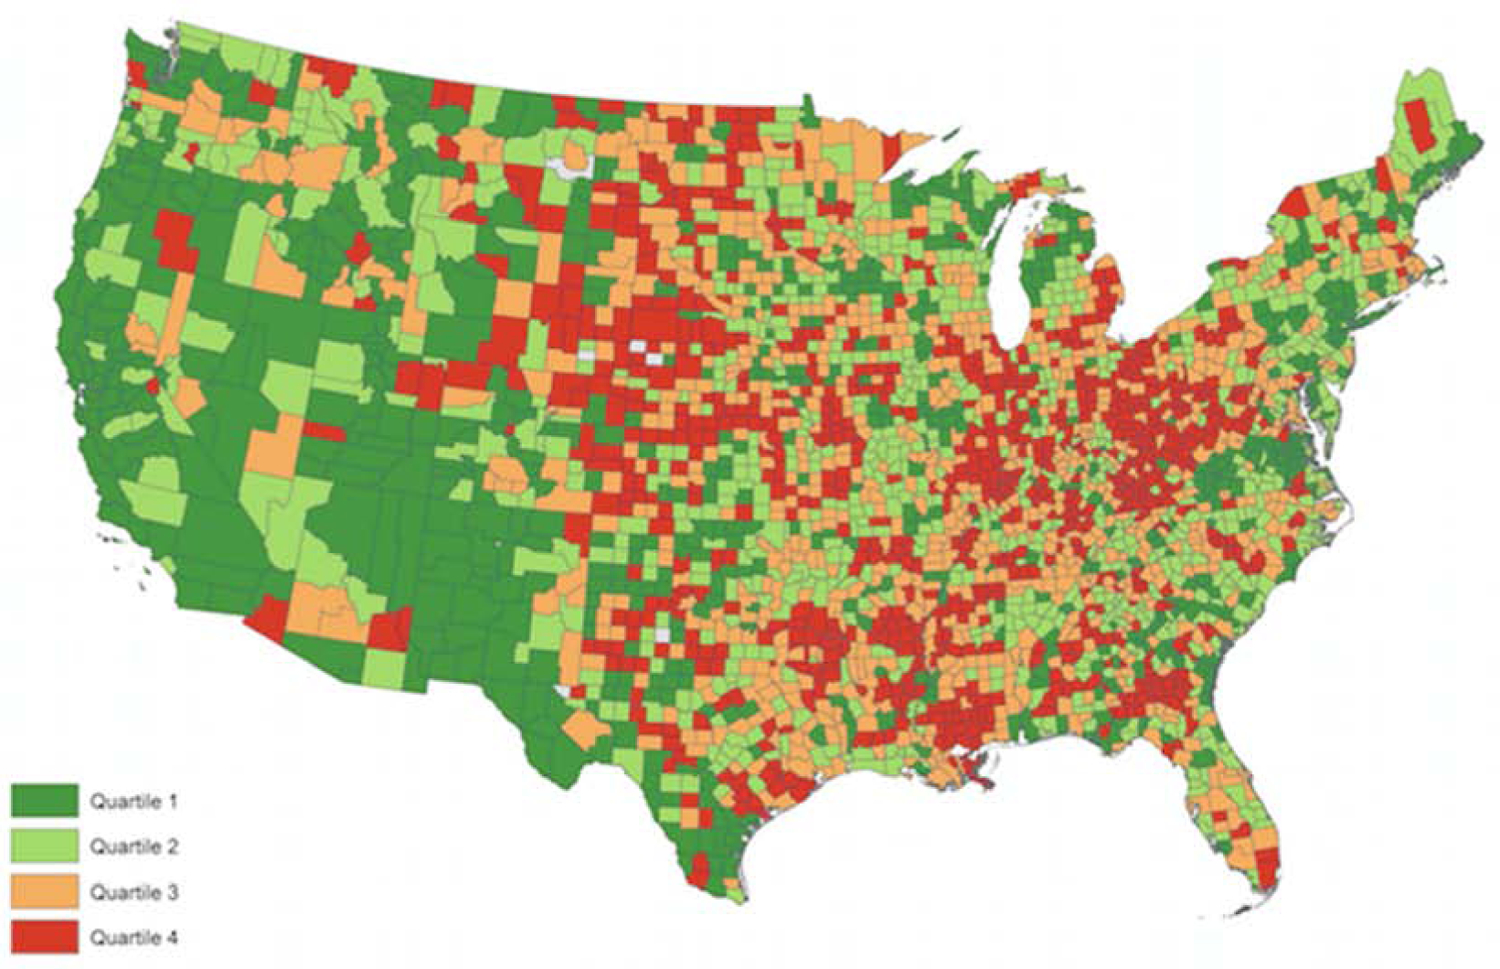
Figure 2. Rate of Medicare beneficiary prevalent observation stays by county, 2014.

United States mapped by beneficiary nine-digit zip code. Per Centers for Medicare & Medicaid Services data use agreement requiring cells of less than 10 to be suppressed, data is presented at the county level to reduce gaps in data presentation. Quartile 1: 3.43% and below; Quartile 2: 3.44–4.59%; Quartile 3: 4.60–5.84%; Quartile 4: 5.85% and above.
