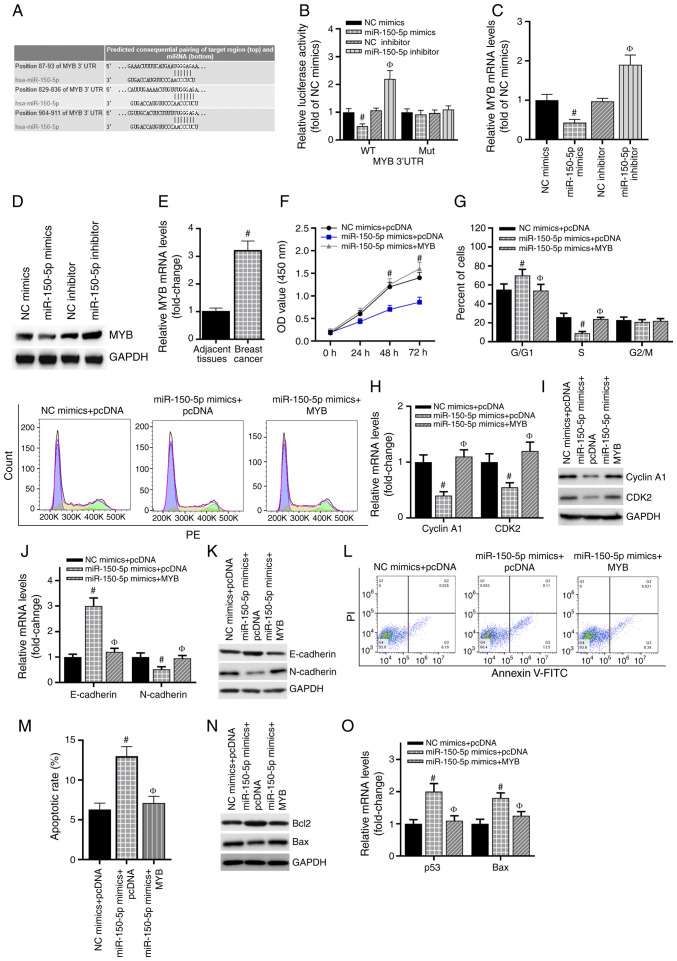
Figure 4.
MYB is directly targeted by miR-150-5p. (A) Predicted miR-150-5p target sites in the MYB 3′UTR. Lines indicate perfect matches. Mut represents a mutation of G to C in the MYB 3′UTR. (B) Relative luciferase activity was detected by luciferase reporter assay. #P<0.05 vs. NC mimics; ФP<0.05 vs. NC inhibitor. (C) RT-qPCR assay was used to detect MYB mRNA expression in each group of cells. #P<0.05 vs. NC mimics; ФP<0.05 vs. NC inhibitor. (D) MYB protein expression was determined by western blotting analysis. (E) The expression of MYB mRNA in clinical tissue samples was confirmed by RT-qPCR. #P<0.05 vs. adjacent tissues. (F) MTS was used to detect cell proliferation of cells transfected with the miR-150-5p mimics and a MYB overexpression vector. #P<0.05 vs. miR-150-5p mimics + pcDNA. (G) The cell cycle was examined using FACS analysis, and the cell cycle distribution was quantified. (H) RT-qPCR was used to detect the expression of cyclin A1 and CDK2. (I) Western blotting analysis was used to detect the protein expression of cyclin A1 and CDK2. (J) The mRNA level of E-cadherin and N-cadherin in MCF-7 cells were detected by RT-qPCR. (K) The protein level of E-cadherin and N-cadherin in MCF-7 cells were detected by western blotting analysis. (L and M) Annexin V-FITC was used to detect the percentage of apoptotic cells in each group. (N) RT-qPCR was used to detect the expression of the Bcl-2 and Bax mRNA. (O) Western blotting analysis was used to detect the protein levels of the Bcl-2 and Bax. #P<0.05 vs. NC mimics + pcDNA; ФP<0.05 vs. miR-150-5p mimics + pcDNA group. miR, microRNA; UTR, untranslated region; RT-qPCR, reverse transcription-quantitative PCR; OD, optical density.

