Figure 2.
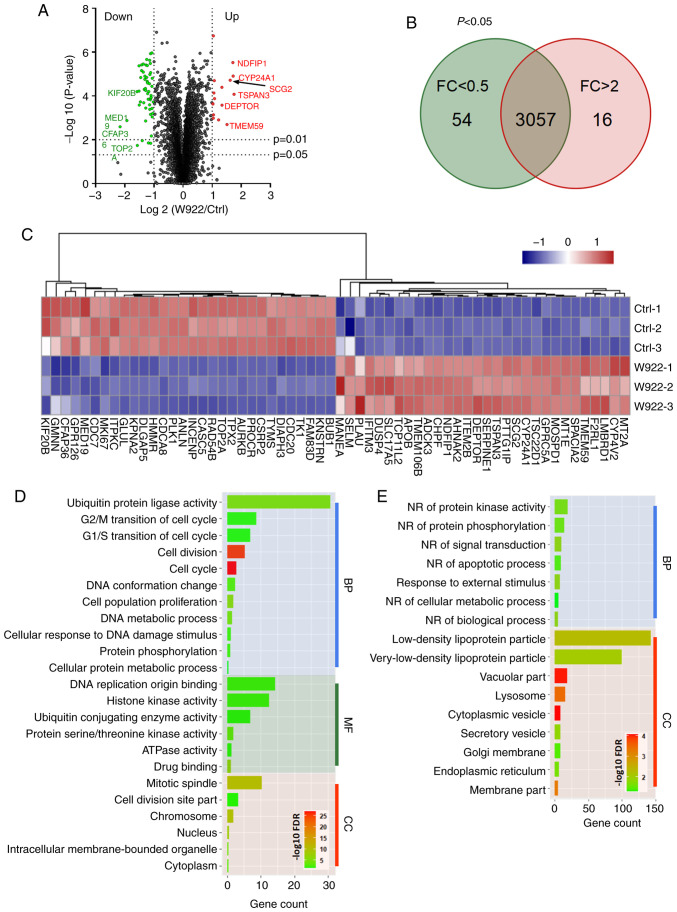
W922 negatively regulates the cell cycle processes. (A) Volcano plot for protein abundances in HCT116 cells after W922 treatment. Red and green color points indicate significant up (FC >2)- and downregulated (FC <0.5) proteins, respectively. The lines represent P-values of 0.01 and 0.05 in two-tailed unpaired t-test. (B) Venn plot for proteins (P<0.05) in HCT116 cells after W922 treatment. (C) Heatmap of top 30 up (right)- and downregulated (left) proteins in W922 treatment. (D) Gene Ontology term enrichment of all significant downregulated proteins (FC <0.5; P<0.05) in W922 treated HCT116 cells. (E) Gene Ontology term enrichment of all significant upregulated proteins (FC >2; P<0.05) in W922 treated HCT116 cells. (n=3-5, unpaired Student's t-test). FC, fold change; Ctrl, control; BP, Biological process; MF, molecular function; CC, Cellular component; NR, negative regulation.

