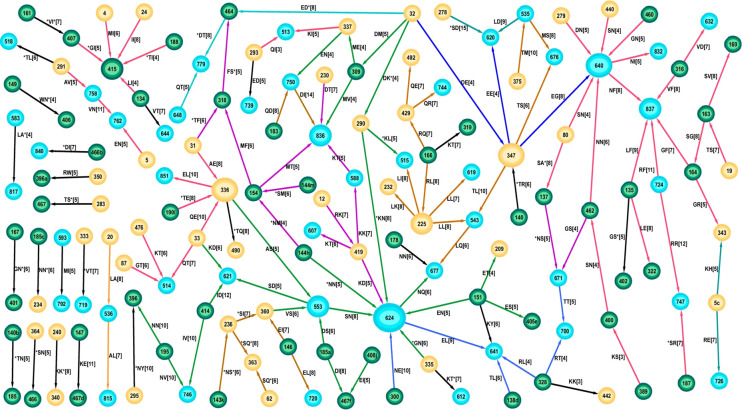
Fig 1. The network of all optimal features expressed by founder subtype B sequences.
The feature represented by each edge is shown as a label on the edge. For example, the label RK [7] on the (directed) edge between nodes 12 and 419 denotes there were 7 sequences containing the feature R12-K419. Labels with an asterisk, eg *TI [4] for the connection between node 188 and 415, denote that the 188 node represents a position within the 3AA of a glycosylation site. Connecting edges that have at least one sequence in common so have matching AA at the node, are drawn with the same color. For example, edges incident to the node 419 have at least one common patient and the same residue Lys (K) at position 419 (R12-K419, K419-K588, K419-T607, K419-D624), and so they are all colored magenta. Nodes representing positions in the constant regions of gp120 are colored yellow, variable region nodes are green, while gp41 nodes are blue. The edges are represented as directed arrows merely to allow proper description of the node AAs.

