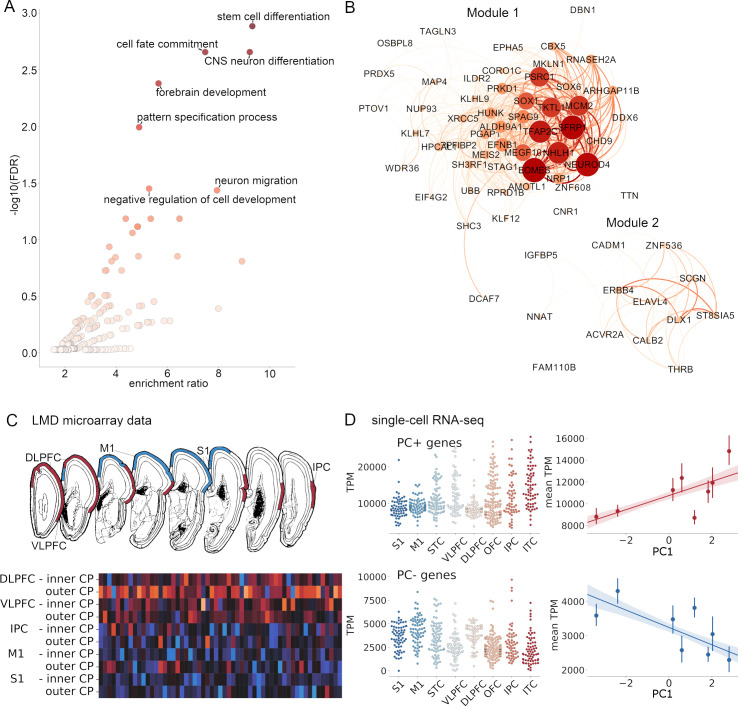
Fig 2. Genes associated with neuronal differentiation are differentially expressed along the principal imaging axis.
(A) Volcano plot showing enrichment of GO terms (biological processes) in genes with age-corrected expression levels positively correlated with PC1. Significantly enriched terms (FDR < 0.05, reference: protein-coding genes) are labelled. (B) Gene co-expression analysis of all PC+ genes revealed 2 modules). Intra-modular connections are shown with node size and colour indicating strength and edge thickness and colour indicating weight. (C) Differential expression of PC+ genes across cortical regions (top) measured using LMD microarrays of the cortical plate in two 21-pcw fetal samples (https://www.brainspan.org/lcm/). Heatmap shows relative expression of all 71 PC+ genes in the inner and outer cortical plate of each labelled region. (D) Total expression (in TPM) of PC+ (top) and PC− (bottom) genes in single cells (n = 572) extracted from cortical regions in an independent single-cell RNA-seq survey of the mid-gestational fetal cortex [51]. Scatterplots show mean TPM averaged over cells in each region, correlated with each region’s PC1 score. See https://github.com/garedaba/baby-brains/tree/master/figures and https://github.com/garedaba/baby-brains/tree/master/results/wgcna. CNS, central nervous system; DLPFC, dorsolateral prefrontal cortex; FDR, false discovery rate; GO, Gene Ontology; IPC, inferior parietal cortex; ITC, inferior temporal cortex; LMD, laser microdissection; M1, primary motor cortex; OFC, orbitofrontal cortex; RNA-seq, RNA sequencing; S1, primary sensory cortex; STC, superior temporal cortex; TPM, transcripts per million; VLPFC, ventrolateral prefrontal cortex.

