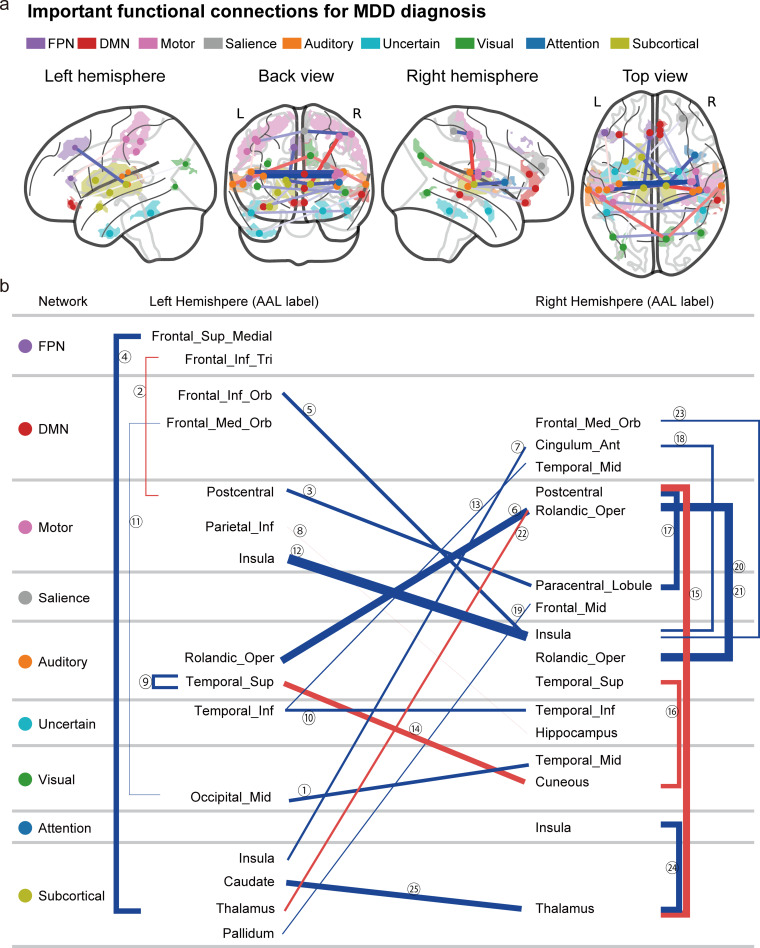
Fig 4. Important FCs for MDD diagnosis.
(a) The 25 FCs viewed from left, back, right, and top. Interhemispheric connections are shown in the back and top views only. Regions are color-coded according to the intrinsic network. The state of functional connectivity exhibiting the smaller (i.e., more negative) and greater (more positive) mean correlation index in the MDD population than in the HC population is termed under- (blue line) and over-connectivity (red line), respectively. The width of the line represents the effect size of the difference (t-value) in the FC values between MDD and HC groups. (b) Listed here are the laterality and anatomical identification of the ROI as identified by the AAL and associated intrinsic networks related to the 25 FCs. AAL, anatomical automatic labeling; DMN, default mode network; FC, functional connectivity; FPN, fronto-parietal network; HC, healthy control; MDD, major depressive disorder; ROI, region of interest. An interactive display of each connection in Fig 4A can be accessed from https://bicr.atr.jp/~imamizu/p5/MDD/.

