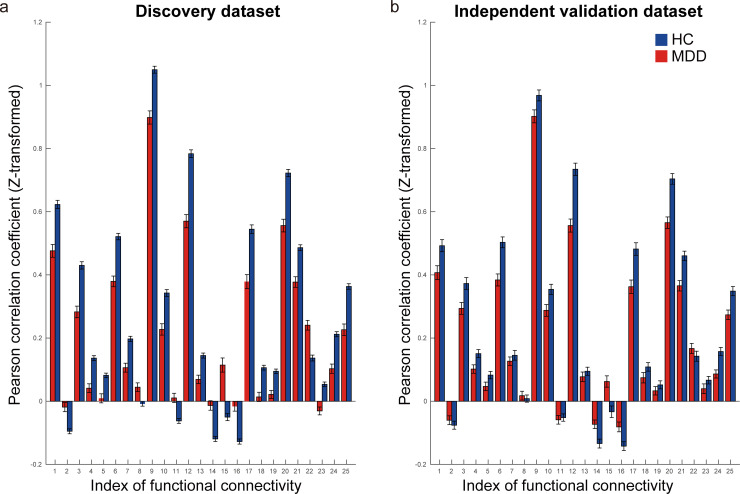
Fig 5. Reproducibility of important FCs for MDD diagnosis.
(a) The FC values for both HCs (blue bar) and patients with MDD (red bar) in the discovery dataset. (b) The FC values for both HCs and patients with MDD in the independent validation dataset. The error bar represents the standard error. The numerical data used in this figure are included in S1 Data. FC, functional connectivity; HCs, healthy controls; MDD, major depressive disorder.

