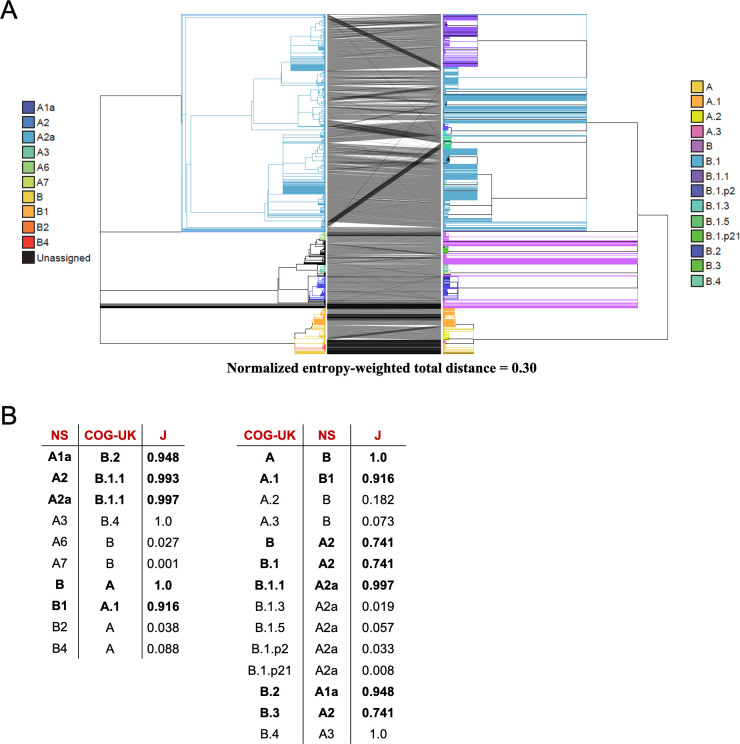
Fig 11. Comparison of Nextstrain and COG-UK trees.
(A) A tanglegram of the Nextstrain tree from 4/19 (left) with the COG-UK tree from 4/24 (right). Each tree has 4167 samples. (B) The COG-UK clades (which they term “lineages”) having the highest Jaccard similarity coefficient (J) with each Nextstrain (NS) named clade and vice versa, where the Jaccard similarity coefficient is computed using the set of samples from the root of that clade. Clades with more than 200 samples are shown in bold font and called “big”, the others “small”. While the naming schemes differ, for each big Nexstrain clade there is a closely corresponding COG-UK clade, and vice-versa.

