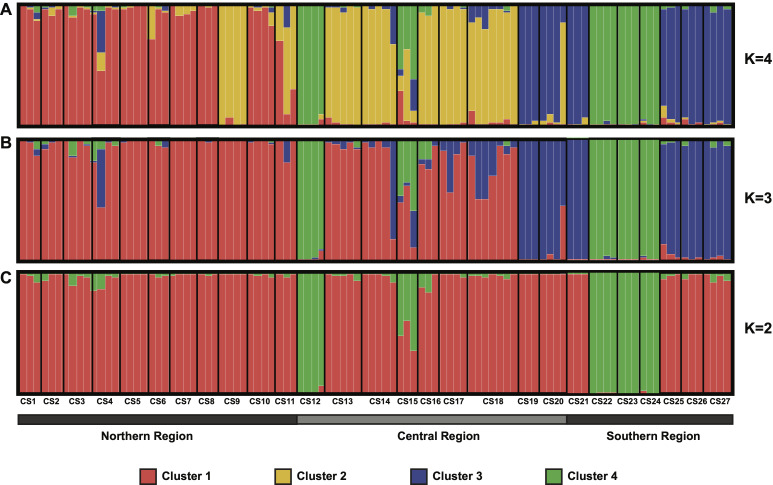
Fig 3. Bayesian analysis of the population structure of V. floribundum genotyped at 16 SSR loci under the Admixture model.
K is the number of genetic lineages represented by different colors. The individual assignment probabilities given the optimal number of lineages (K = 4, based on ΔK = 110.9) (A) are compared to the assignment probabilities for K = 3 (B) and for K = 2 (C). Individuals on the plots are ordered from left to right based on their sampling locations along the northern to southern axis (of the Ecuadorian Highlands), from CS1 (La Cofradia in Carchi), to CS27 (Podocarpus in Loja) (S1 Table).

