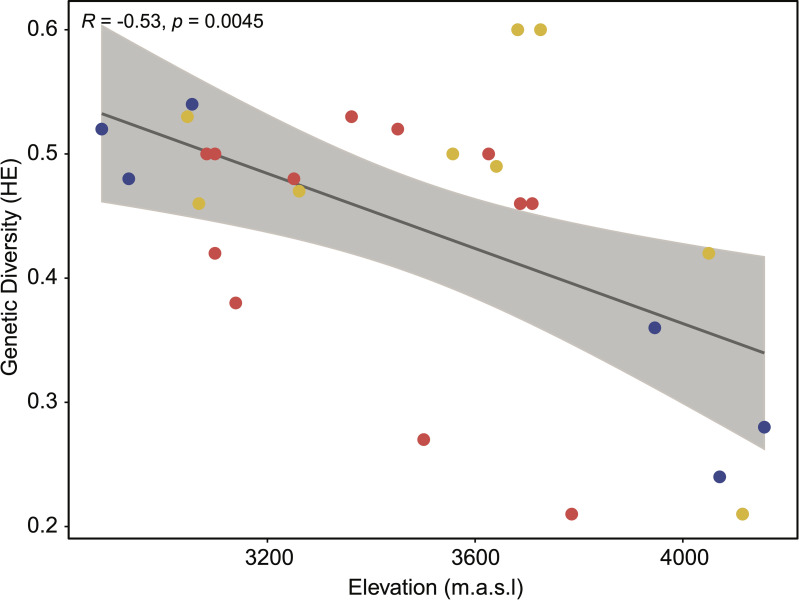
Fig 5. Linear regression between V. floribundum genetic diversity and elevation.
The plot shows the correlation between elevation (x-axis) and the genetic diversity (y-axis), assessed through the expected heterozygosity estimates per collection sites (confidence interval = 95%). Each data point represents one collection site where the individuals were sampled in this study (total of 27 collection sites).

