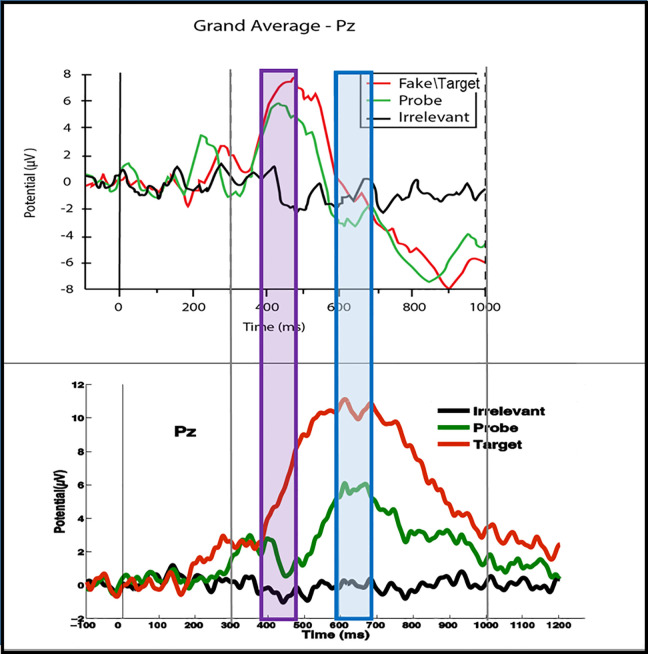
Fig 1. ERPs from two Rapid Serial Visual Presentation (RSVP) experiments at the Pz electrode.
The top panel experiment was published in [11]. The lower panel shows unpublished data. The experiments use very similar presentation paradigms, with name stimuli in both cases; see Supporting Information S5 Text for details. Even though the design differences between the two experiments are small, the timing and form of the P3b component is very different. Of particular interest here is that the Target P3bs (red lines) were very different in the two experiments, as were the Probe P3bs (green lines). For example, the blue region marks the peak of the Probe P3b in the second experiment (lower panel), which misses the corresponding Probe P3b peak in the first experiment (upper panel). In fact, the misalignment of the P3b effects in the two experiments is so great that the P3b in the second experiment is aligned with the negative rebound to the P3b peak in the first experiment. Additionally, the purple region marks the peak of the Probe P3b in the upper panel, which clearly precedes the peak in the lower panel.

