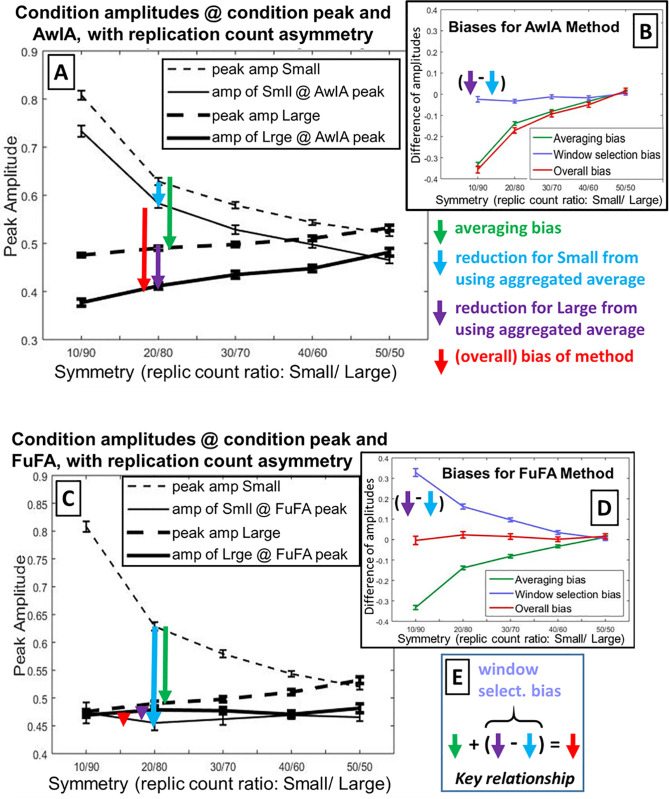
Fig 6. Results of simulations.
The null-hypothesis was simulated for five replication count asymmetries, from highly unbalanced (10/90) to fully balanced (50/50), with the dependent measure being peak amplitudes of condition averages. Panels A and B show results for AwIA, while Panels C and D show results for FuFA. Panels A (for AwIA) and C (for FuFA) show the main results. Dashed lines show peak amplitudes for Small and Large, i.e. when the peak amplitude is read-directly off from the condition averages, without any involvement of an aggregated average. The difference between these lines is the (simple) averaging bias (see green arrow), which is identical for AwIA and FuFA and in both cases, reduces to zero when replication counts are balanced (50/50). Solid lines show amplitudes for Small and Large, when the peak’s location is selected from the aggregated average (AwIA for Panel A and FuFA for Panel C). Thus, the difference between solid lines is the overall bias of the method (as indicated by red arrows). In (C), these sit on top of each other, showing that there is no overall bias, while only when replication counts are equalised (i.e. 50/50), do the solid lines coincide in (A). We show, with blue and purple arrows, the amount the amplitude is reduced as a result of going via the aggregated average. Each of these is presented as a reduction,i.e. how much less the amplitude is at the time-point found from the aggregated average than at the true condition peak. The length of the blue and purple arrows reflects the degree to which the aggregated average is “like” Small or “like” Large. As illustrated in Fig 4, the AwIA is more like the Small condition, while the FuFA is more like the Large condition. Accordingly, the reduction due to AwIA (see Panel A) is less for Small than for Large, while the reduction due to FuFA (see Panel C) is dramatically more for Small than for Large. In both cases, this difference in reductions itself reduces until parity is reached at full balance (50/50), see Panels A and C. This difference in these two reductions (one for Small, the other for Large) is the window selection bias. As previously indicated, the (overall) bias (i.e. difference between solid lines) due to employing an aggregated average process is shown with the red arrows. For the AwIA, Panel A, this (overall) bias is substantial at large replication-count asymmetries, but as would be expected, progresses to zero with fully balanced designs. In contrast, for the FuFA, save for sampling error, there is no (overall) bias at any asymmetries. Panels B and D summarise biases for AwIA (respectively FuFA). The (simple) averaging bias is the same for AwIA and FuFA, see green arrows and lines. But, while the window selection bias (difference of amplitude reductions, Large minus Small; light purple line), has a small effect in the same direction as the averaging bias for AwIA, it is equal and opposite to the averaging bias for FuFA. The overall bias, red arrows and lines, is substantial with large replication-count asymmetries for AwIA, but absent for all replication-count asymmetries for FuFA. Standard errors of the mean are shown. Panel E: Overall bias is the sum of the (simple) averaging bias and window selection bias (which itself is a difference of reductions for Large and Small).

