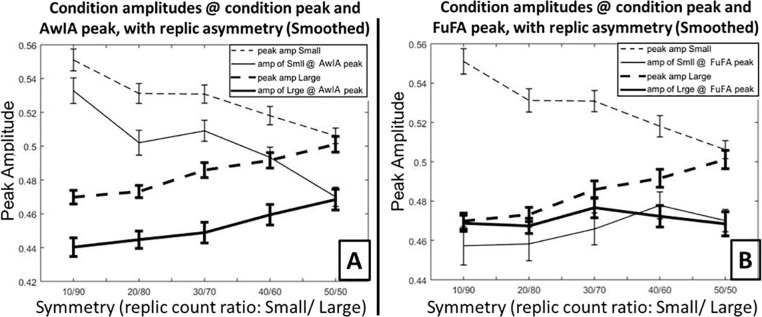
Fig 8. Results of simulations with smoothing down replication data samples.
The null-hypothesis was simulated for five asymmetries, from highly unbalanced (10/90) to fully balanced (50/50). Panel A shows results for AwIA, and Panel B results for FuFA. In both panels, dashed lines show peak amplitudes for the two conditions, Small and Large, i.e. when the peak amplitude is read-directly off from the condition average, without any involvement of an aggregated average. The difference between these lines is the (simple) averaging bias, which is identical for AwIA and FuFA and in both cases, reduces to zero when replication-counts are balanced (50/50). Solid lines show amplitudes for Small and Large, when the location of the amplitude is selected as a peak from the aggregated average (AwIA for Panel A and FuFA for Panel B). In sum, the smoothing employed here has had little effect on the major patterns present in these figures. That is, the AwIA (panel A here) still exhibits a bias, which increases with replication-count asymmetry (i.e. moving from right to left along x-axis), while there is no apparent bias for FuFA (panel B here) at any asymmetry. This can be seen by comparing solid lines (condition amplitudes at aggregated average peaks), the difference of which is the overall bias.

