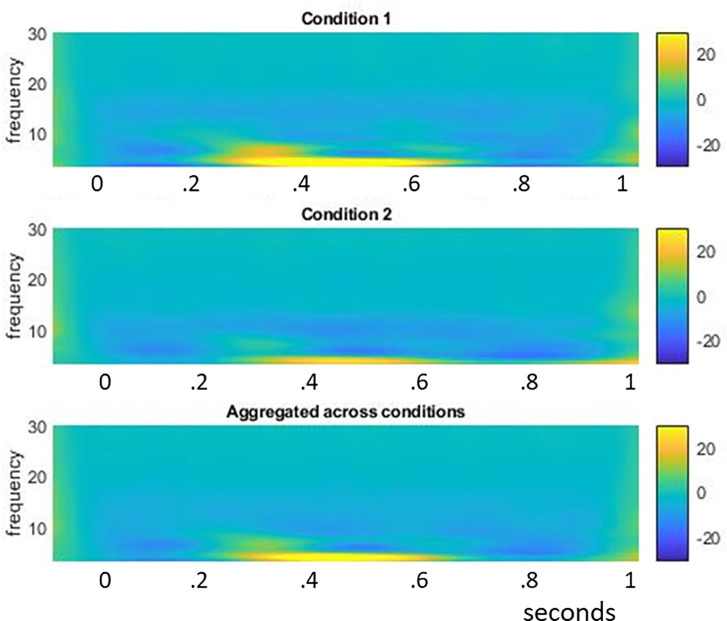
Fig 10. time-frequency plots of example statistical power data simulations.
We show typical plots of condition 1 and condition 2, as well as of the aggregated average. As can be seen, since the main time-frequency feature appears at the same point for both condition 1 and condition 2, the aggregated average plot also reflects this dominant feature.

