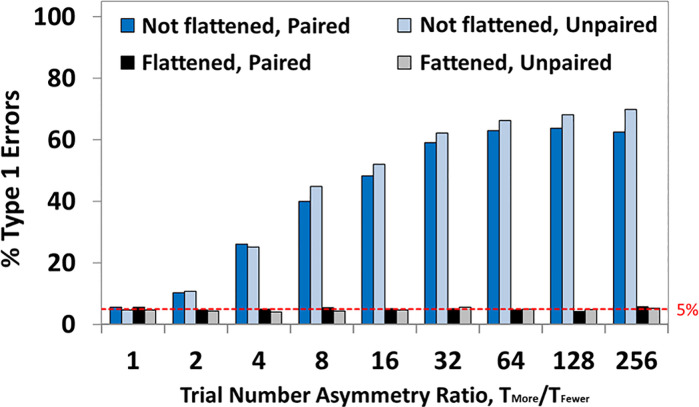
Fig 12. Results of simulation of null, incorporating a within-participant test.
The simulation involved two levels of noise. The inter-trial noise source was independently generated on each trial, but the same algorithm was used across trials, participants, and conditions (see Brooks et a [8]). Inter-participant noise was generated independently for each participant. The exact same noise was added to every trial (in both conditions) for the participant. The results of this simulation (noise-only data) clearly showed that the pattern of Type I error rates was not substantially different between paired and unpaired data sets (compare dark bars to lighter coloured bars). There is clear evidence of inflation of the false positive rate when a non-flattened average is taken (i.e. the AwIA). This inflation is eradicated when the flattened average (i.e. the FuFA) is taken. The plot in this figure is for noise-only data, but we include a similar simulation incorporating a within-participant experiment with a strong N170 signal present in Supporting Information S8 Text. The N170 results again show similar results for paired and unpaired data.

