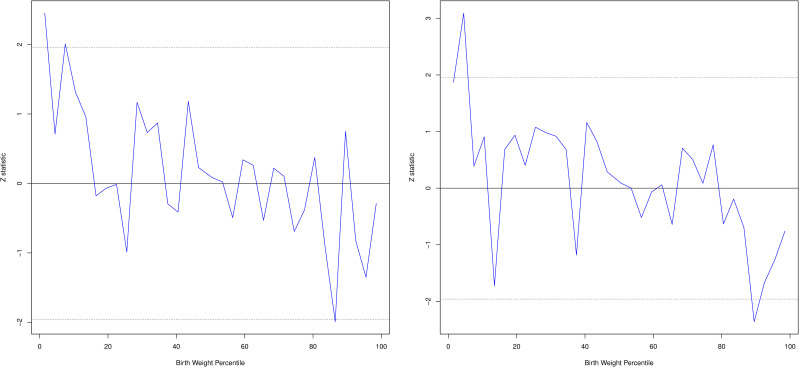
Fig 3.
Difference between observed Z statistic for BW Z score (blue line) and simulated mean of birth weight GS (under a fully polygenic model; solid black line) and simulated upper and lower 95 percentiles (dotted black line) by 3% phenotype bins for fetal GS (left) and maternal GS (right) in ALSPAC.

