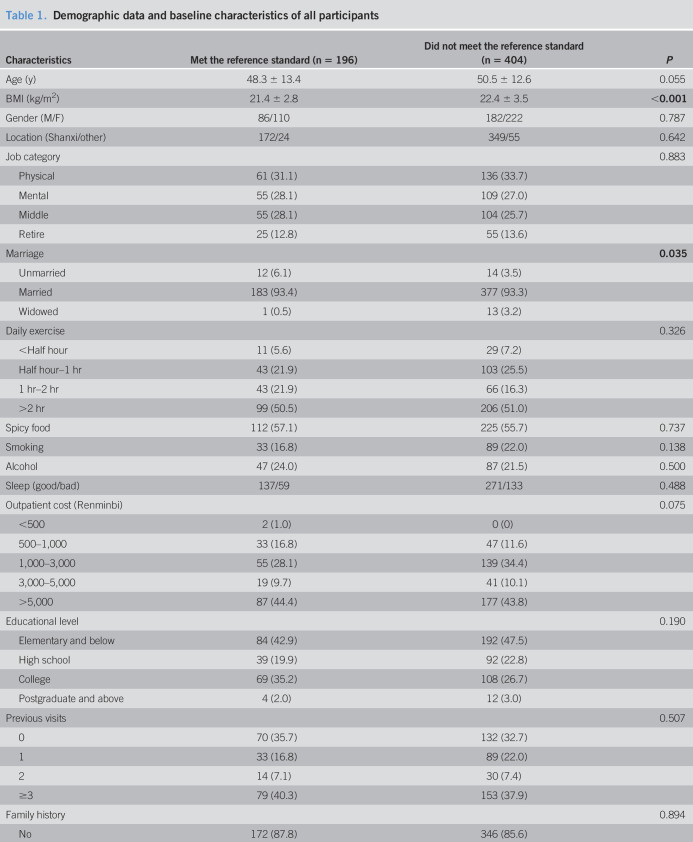
Table 1.
Demographic data and baseline characteristics of all participants
![]()
| Characteristics | Met the reference standard (n = 196) | Did not meet the reference standard (n = 404) | P |
| Age (y) | 48.3 ± 13.4 | 50.5 ± 12.6 | 0.055 |
| BMI (kg/m2) | 21.4 ± 2.8 | 22.4 ± 3.5 | <0.001 |
| Gender (M/F) | 86/110 | 182/222 | 0.787 |
| Location (Shanxi/other) | 172/24 | 349/55 | 0.642 |
| Job category | 0.883 | ||
| Physical | 61 (31.1) | 136 (33.7) | |
| Mental | 55 (28.1) | 109 (27.0) | |
| Middle | 55 (28.1) | 104 (25.7) | |
| Retire | 25 (12.8) | 55 (13.6) | |
| Marriage | 0.035 | ||
| Unmarried | 12 (6.1) | 14 (3.5) | |
| Married | 183 (93.4) | 377 (93.3) | |
| Widowed | 1 (0.5) | 13 (3.2) | |
| Daily exercise | 0.326 | ||
| <Half hour | 11 (5.6) | 29 (7.2) | |
| Half hour–1 hr | 43 (21.9) | 103 (25.5) | |
| 1 hr–2 hr | 43 (21.9) | 66 (16.3) | |
| >2 hr | 99 (50.5) | 206 (51.0) | |
| Spicy food | 112 (57.1) | 225 (55.7) | 0.737 |
| Smoking | 33 (16.8) | 89 (22.0) | 0.138 |
| Alcohol | 47 (24.0) | 87 (21.5) | 0.500 |
| Sleep (good/bad) | 137/59 | 271/133 | 0.488 |
| Outpatient cost (Renminbi) | 0.075 | ||
| <500 | 2 (1.0) | 0 (0) | |
| 500–1,000 | 33 (16.8) | 47 (11.6) | |
| 1,000–3,000 | 55 (28.1) | 139 (34.4) | |
| 3,000–5,000 | 19 (9.7) | 41 (10.1) | |
| >5,000 | 87 (44.4) | 177 (43.8) | |
| Educational level | 0.190 | ||
| Elementary and below | 84 (42.9) | 192 (47.5) | |
| High school | 39 (19.9) | 92 (22.8) | |
| College | 69 (35.2) | 108 (26.7) | |
| Postgraduate and above | 4 (2.0) | 12 (3.0) | |
| Previous visits | 0.507 | ||
| 0 | 70 (35.7) | 132 (32.7) | |
| 1 | 33 (16.8) | 89 (22.0) | |
| 2 | 14 (7.1) | 30 (7.4) | |
| ≥3 | 79 (40.3) | 153 (37.9) | |
| Family history | 0.894 | ||
| No | 172 (87.8) | 346 (85.6) | |
| Esophagus cancer | 6 (3.1) | 16 (4.0) | |
| Gastric cancer | 13 (6.6) | 29 (7.2) | |
| Other | 5 (2.6) | 13 (3.2) |
Values are expressed as the mean ± SD or n (%). Bold entries represent P < 0.05.
BMI, body mass index; F, female; M, male.


