
FIGURE 1.
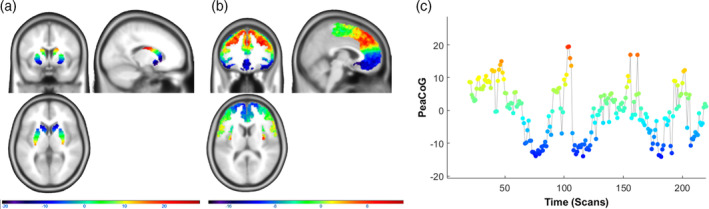
Frontostriatal connectivity gradient and dynamic PeaCoG time course. (a) Locations of striatal voxels projected on the empirically estimated striatal gradient. (b) Striatal peak connectivity locations on the gradient of frontal voxels (PeaCoG maps) averaged over the whole sample. A medial‐ventral‐rostral to lateral‐dorsal‐caudal organizational pattern of frontostriatal connectivity is clearly visible. Please note that the scale of the colors in display B is more restricted than in display A, which presumably is due to a regression to the mean effect related to the averaging. (c) Dynamic striatal peak connectivity of a voxel in the left dlPFC (Figure 3) during the resting state session in a single patient with AUD that was not specifically selected (first participant of the sample). The y‐axis and the colors correspond to striatal locations in Figure 1a. We conducted dynamic PeaCoG analyses based on sliding window dynamic functional connectivity with window sizes of 15, 20, 30, and 45 volumes, the example time course is shown for a window size of 20 volumes