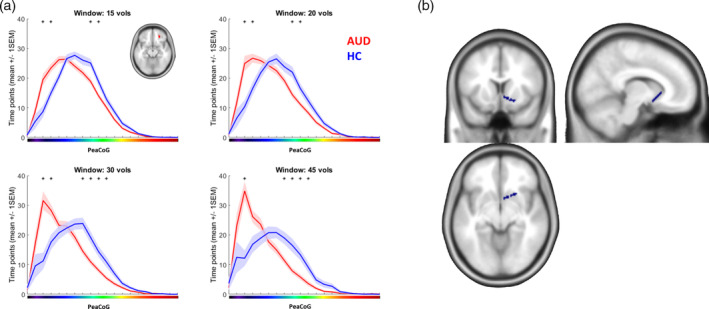
FIGURE 2.

rOFC cluster dynamic PeaCoG spatial distribution. (a) Number of time points the right OFC cluster (small inlay) dynamic peak connectivity fell into spatial bins in the striatum during the resting state session averaged over groups. The results demonstrate a ventral shift of dynamic rOFC‐striatal connectivity in the AUD group. The x‐axis corresponds to striatal locations in Figure 1a. Small asterisks mark bins where the number of time points was significantly different between the groups (p < .05 Bonferroni corrected for the number of bins [20]). Shaded areas represent the SEM. (b) Area in the striatum (blue) corresponding to the bin of the gradient where more connectivity in the AUD group was consistently detected over the different window sizes
